Technical Analysis of OAEM 2024-05-10
Overview:
In analyzing the technical indicators for OAEM stock over the last 5 days, we will delve into the trend, momentum, volatility, and volume indicators to provide a comprehensive outlook on the possible stock price movement in the coming days. By examining these key indicators, we aim to offer valuable insights and predictions for potential investors.
Trend Indicators:
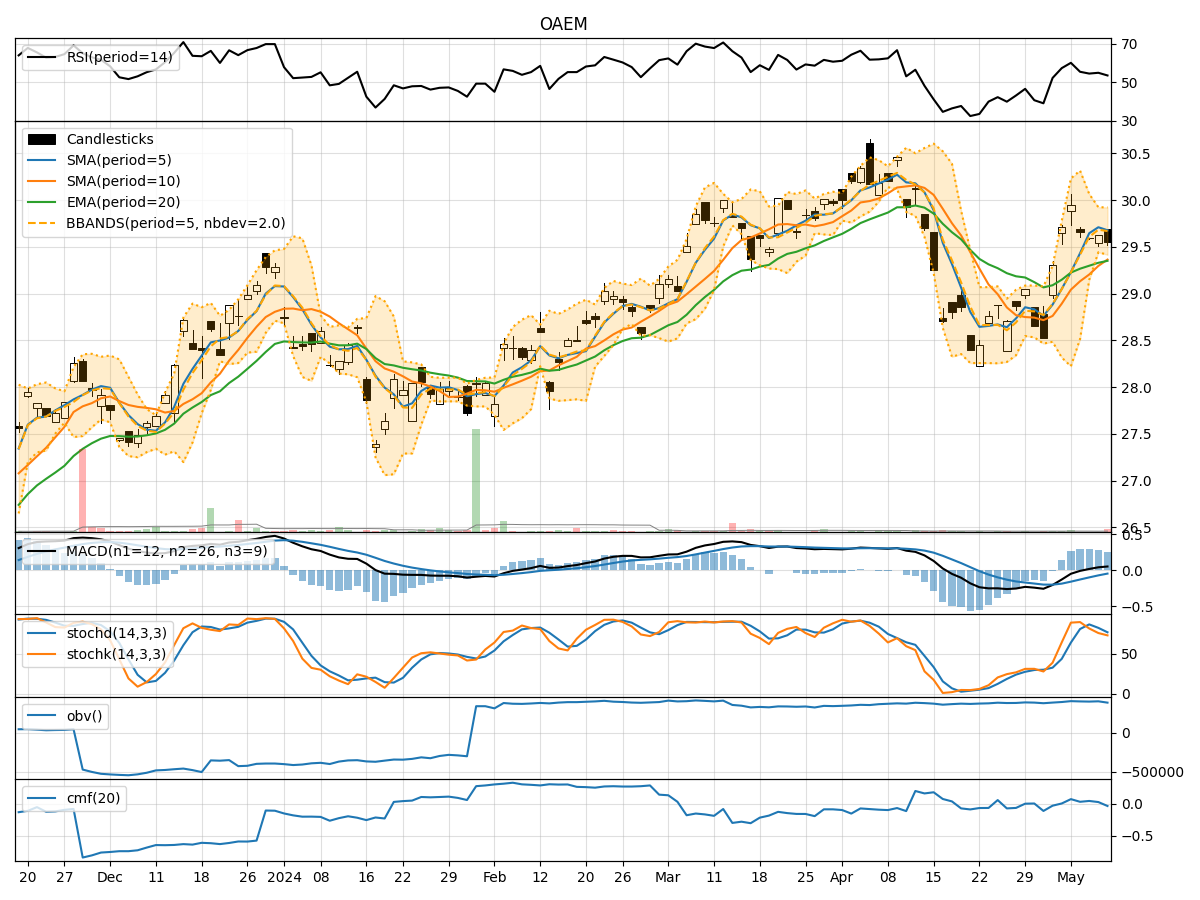
- Moving Averages (MA): The 5-day moving average has been consistently above the longer-term simple moving average (SMA) and exponential moving average (EMA), indicating a short-term uptrend.
- MACD: The MACD line has been consistently above the signal line, with both lines trending upwards, suggesting bullish momentum.
- MACD Histogram: The histogram has been increasing over the past few days, indicating strengthening bullish momentum.
Momentum Indicators:
- RSI: The Relative Strength Index (RSI) has been fluctuating around the 50 level, indicating a lack of strong overbought or oversold conditions.
- Stochastic Oscillator: Both %K and %D lines have been trending downwards, suggesting a potential bearish momentum.
- Williams %R: The Williams %R indicator has been in the oversold territory, indicating a possible reversal in the short term.
Volatility Indicators:
- Bollinger Bands: The stock price has been trading within the Bollinger Bands, with the bands narrowing, indicating decreasing volatility.
- Bollinger %B: The %B indicator has been hovering around the middle range, suggesting a neutral stance in terms of volatility.
Volume Indicators:
- On-Balance Volume (OBV): The OBV has been fluctuating, indicating mixed buying and selling pressure.
- Chaikin Money Flow (CMF): The CMF has been positive but decreasing, signaling a potential weakening of buying pressure.
Key Observations and Opinions:
- Trend: The trend indicators suggest a bullish bias in the short term.
- Momentum: The momentum indicators show a mixed picture, with some indicators hinting at a potential bearish reversal.
- Volatility: Volatility has been decreasing, indicating a possible period of consolidation.
- Volume: The volume indicators reflect mixed market sentiment, with no clear direction.
Conclusion:
Based on the analysis of the technical indicators, the next few days for OAEM stock could see sideways movement with a slight bearish bias. Investors should closely monitor key support and resistance levels for potential entry or exit points. It is advisable to wait for more confirmation from the indicators before making significant trading decisions.