Technical Analysis of OAIA 2024-05-10
Overview:
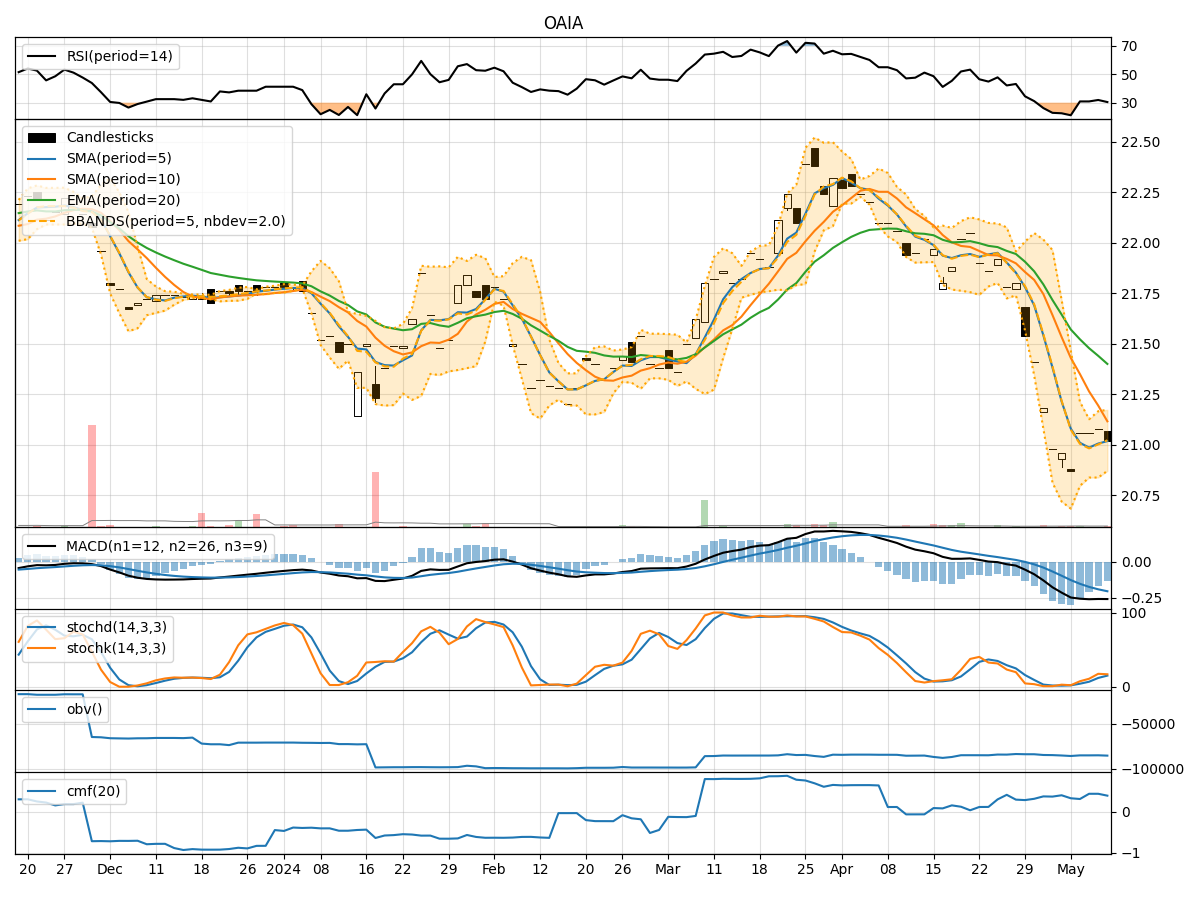
In the last 5 trading days, the stock has shown a relatively stable price movement with minor fluctuations. The trend indicators suggest a slight bearish sentiment, with the moving averages and MACD showing a downward trend. Momentum indicators indicate a neutral to slightly bearish momentum, while volatility indicators show a narrowing Bollinger Bands, indicating decreasing volatility. Volume indicators suggest a consistent accumulation of volume.
Trend Indicators:
- Moving Averages (MA): The 5-day MA is below both the SMA(10) and EMA(20), indicating a short-term bearish trend.
- MACD: The MACD line is below the signal line, indicating a bearish trend.
- MACD Histogram: The MACD histogram is negative and decreasing, further confirming the bearish sentiment.
Key Observation: The trend indicators point towards a downward trend in the stock price.
Momentum Indicators:
- RSI: The RSI is below 50, indicating a neutral to slightly bearish momentum.
- Stochastic Oscillator: Both %K and %D are below 20, suggesting an oversold condition.
- Williams %R: The Williams %R is below -80, indicating a bearish momentum.
Key Observation: The momentum indicators suggest a bearish momentum in the stock.
Volatility Indicators:
- Bollinger Bands (BB): The Bollinger Bands are narrowing, indicating decreasing volatility.
- Bollinger %B: The %B is below 1, suggesting the price is at the lower band.
Key Observation: Volatility is decreasing, and the stock price is currently at the lower band of the Bollinger Bands.
Volume Indicators:
- On-Balance Volume (OBV): The OBV shows a consistent accumulation of volume over the last 5 days.
- Chaikin Money Flow (CMF): The CMF is positive, indicating buying pressure.
Key Observation: Volume indicators suggest accumulation of the stock.
Conclusion:
Based on the analysis of the technical indicators, the stock is likely to experience further downward movement in the next few days. The trend indicators, momentum indicators, and the current position of the stock price relative to Bollinger Bands all point towards a bearish outlook. However, the consistent accumulation of volume indicates underlying buying pressure, which could potentially limit the extent of the downward movement.
Recommendation:
- Short-term Traders: Consider shorting the stock or waiting for a better entry point as the indicators suggest a bearish trend.
- Long-term Investors: Monitor the stock closely for a potential reversal signal before considering any buying opportunities.
Overall View: The stock is currently in a bearish phase with a potential for further downside in the short term.