Technical Analysis of OAIB 2024-05-10
Overview:
In analyzing the technical indicators for OAIB stock over the last 5 days, we will delve into the trend, momentum, volatility, and volume indicators to provide a comprehensive outlook on the possible future stock price movement. By examining these key indicators, we aim to offer valuable insights and predictions for the upcoming trading days.
Trend Indicators:
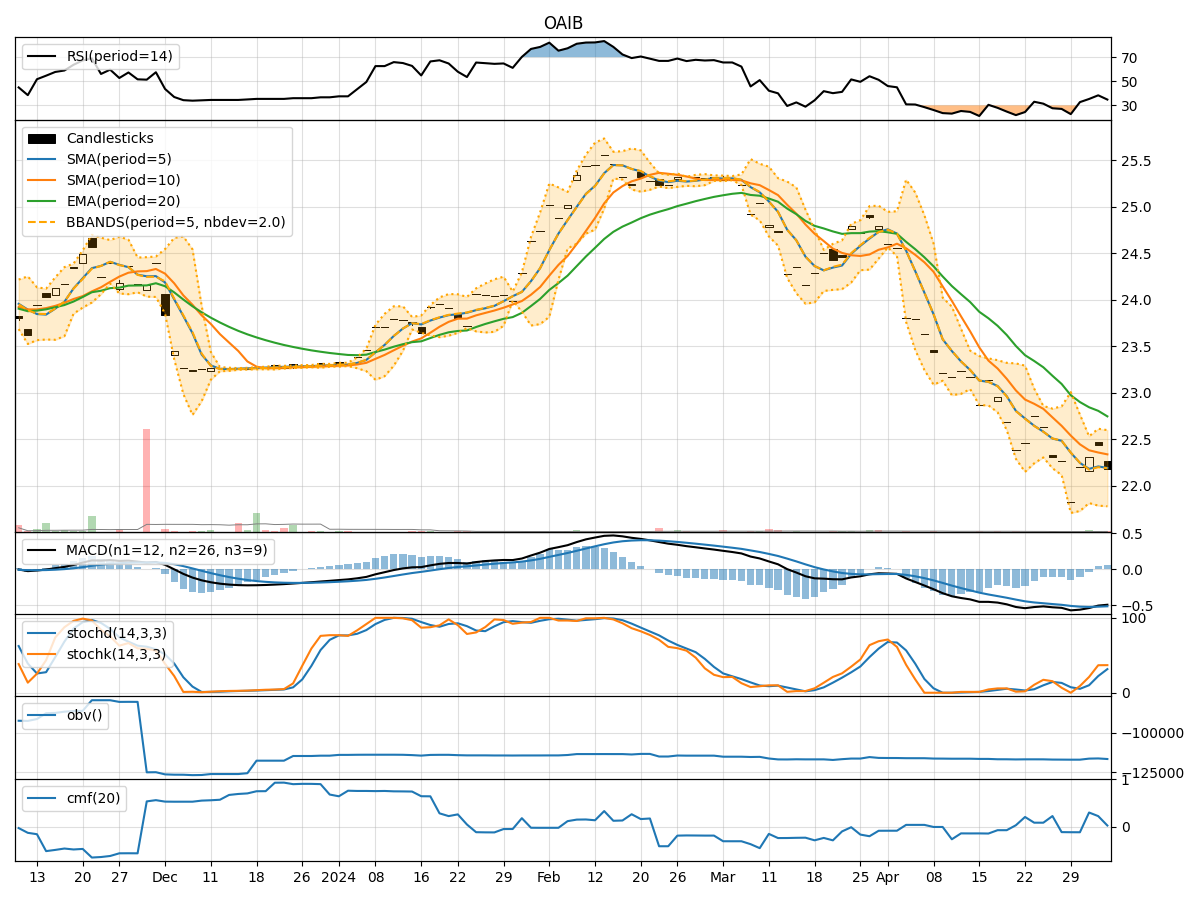
- Moving Averages (MA): The 5-day MA has been consistently below the closing price, indicating a short-term downtrend.
- MACD: The MACD line has been below the signal line, suggesting a bearish momentum.
- EMA: The exponential moving average has been trending downwards, reflecting a weakening trend.
Momentum Indicators:
- RSI: The RSI has been hovering around the oversold territory, indicating a potential reversal or consolidation.
- Stochastic Oscillator: Both %K and %D have been relatively low, signaling a potential oversold condition.
- Williams %R: The indicator has been in the oversold region, suggesting a possible reversal in the near term.
Volatility Indicators:
- Bollinger Bands: The stock price has been trading within the lower Bollinger Band, indicating a potential oversold condition.
- Bollinger %B: The %B indicator is below 0.2, suggesting a possible undervalued scenario.
Volume Indicators:
- On-Balance Volume (OBV): The OBV has been declining, indicating selling pressure in the stock.
- Chaikin Money Flow (CMF): The CMF has been positive but trending downwards, signaling a potential outflow of money from the stock.
Key Observations:
- The stock is currently in a downtrend based on moving averages and MACD.
- Momentum indicators suggest a possible reversal or consolidation in the near term.
- Volatility indicators point towards an oversold condition.
- Volume indicators indicate selling pressure and a potential outflow of money.
Conclusion:
Based on the analysis of the technical indicators, the stock is likely to experience further downside movement in the next few days. The combination of a downtrend in moving averages, bearish momentum signals, oversold conditions in volatility indicators, and selling pressure in volume indicators all point towards a continued bearish outlook. Traders and investors should exercise caution and consider shorting or staying on the sidelines until a clear reversal pattern emerges.