Technical Analysis of OALC 2024-05-10
Overview:
In analyzing the technical indicators for OALC stock over the last 5 days, we will delve into the trend, momentum, volatility, and volume indicators to provide a comprehensive outlook on the possible stock price movement in the coming days. By examining these key indicators, we aim to offer valuable insights and predictions for potential investors.
Trend Analysis:
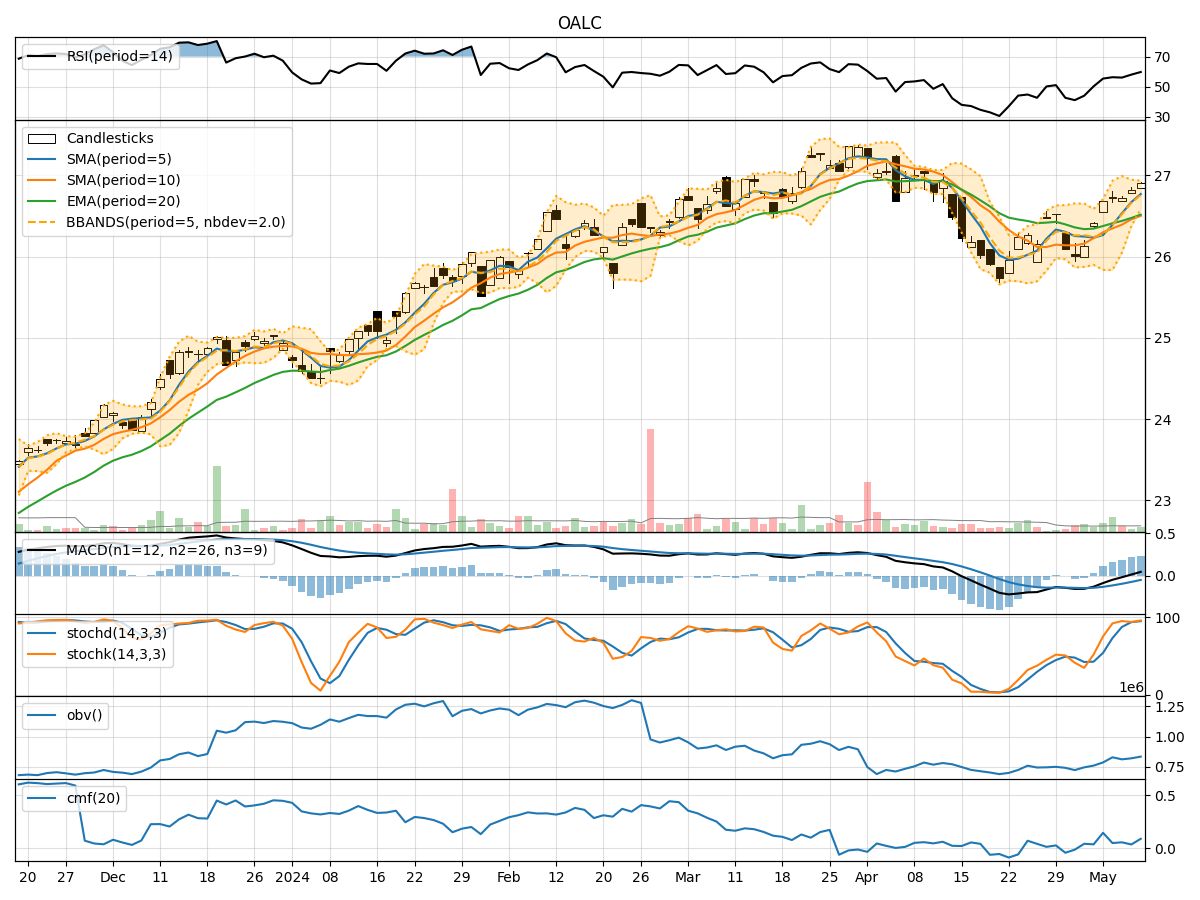
- Moving Averages (MA): The 5-day Moving Average (MA) has been trending above the Simple Moving Average (SMA) and Exponential Moving Average (EMA) over the past 5 days, indicating a short-term bullish trend.
- MACD: The Moving Average Convergence Divergence (MACD) has shown positive values, with the MACD line consistently above the Signal line, suggesting bullish momentum in the stock price.
- Conclusion: The trend indicators point towards an upward trend in the stock price.
Momentum Analysis:
- RSI: The Relative Strength Index (RSI) has been increasing steadily and is currently in the overbought territory, indicating strong buying momentum.
- Stochastic Oscillator: Both %K and %D lines of the Stochastic Oscillator are in the overbought zone, suggesting a potential reversal or consolidation.
- Conclusion: The momentum indicators signal a potential consolidation or reversal in the stock price.
Volatility Analysis:
- Bollinger Bands: The Bollinger Bands are narrowing, indicating decreasing volatility in the stock price.
- Conclusion: The volatility indicators suggest a decrease in volatility and a possible period of consolidation.
Volume Analysis:
- On-Balance Volume (OBV): The OBV has been fluctuating but has not shown a clear trend, indicating mixed buying and selling pressure.
- Chaikin Money Flow (CMF): The CMF has been positive but relatively stable, reflecting a consistent inflow of money into the stock.
- Conclusion: The volume indicators suggest a neutral stance with no clear direction in buying or selling pressure.
Overall Conclusion:
Based on the analysis of trend, momentum, volatility, and volume indicators, the next few days' possible stock price movement for OALC is likely to be sideways or consolidation with a potential for a reversal. Investors should closely monitor the momentum indicators for any signs of a shift in the current trend. It is advisable to exercise caution and wait for clearer signals before making any significant trading decisions.
Key Recommendations:
- Monitor Momentum Indicators: Keep a close eye on the Stochastic Oscillator and RSI for any signs of a reversal or continuation of the current trend.
- Watch for Breakout: Look for a decisive breakout above or below the current trading range to confirm the next direction.
- Consider Risk Management: Implement proper risk management strategies to protect your investments in case of unexpected price movements.
By combining technical analysis with market insights, investors can make more informed decisions and navigate the stock market with confidence.