Technical Analysis of OARK 2024-05-10
Overview:
In analyzing the technical indicators for OARK stock over the last 5 days, we will delve into the trends, momentum, volatility, and volume indicators to provide a comprehensive outlook on the possible future stock price movement. By examining key metrics such as moving averages, MACD, RSI, Bollinger Bands, and OBV, we aim to offer valuable insights and predictions for the upcoming trading days.
Trend Analysis:
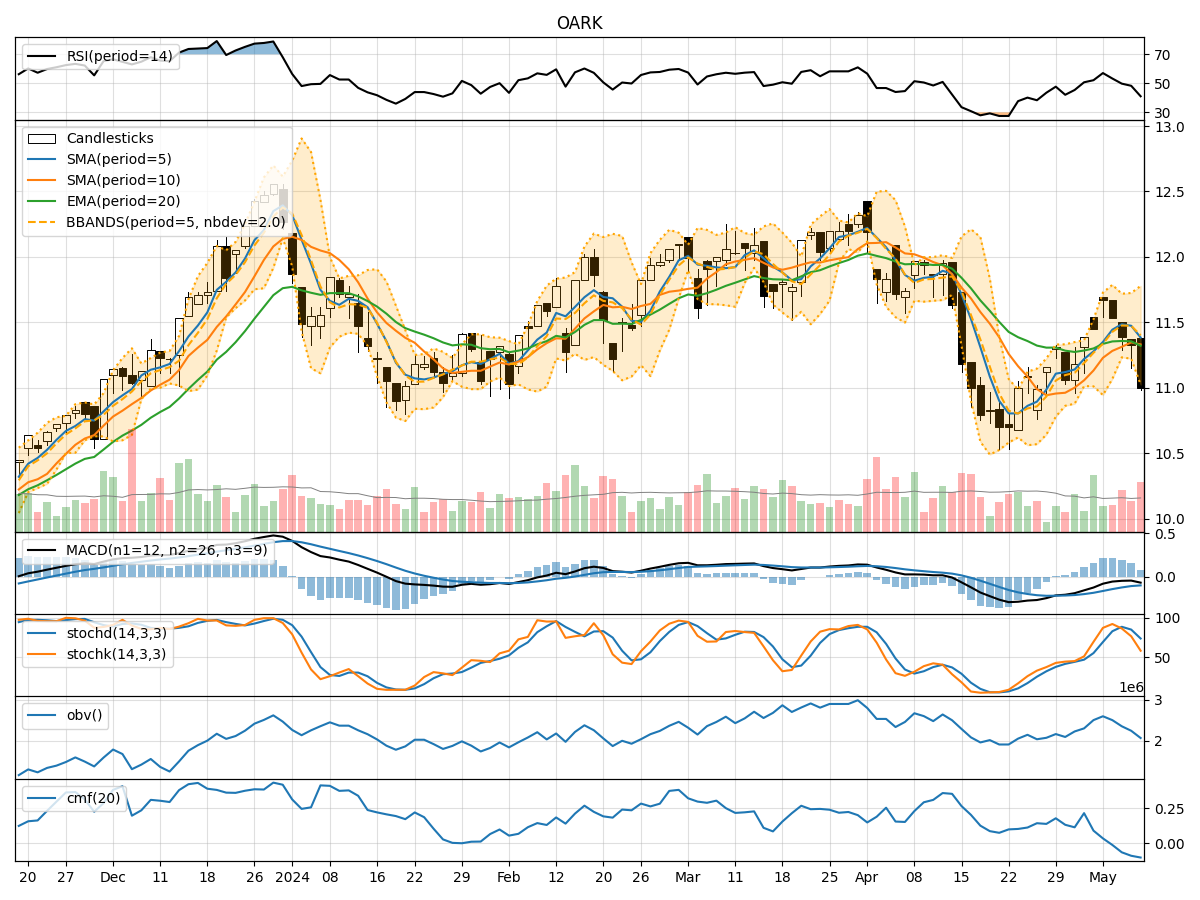
- Moving Averages (MA): The 5-day MA has been fluctuating around the closing prices, indicating short-term price trends. The stock has been trading below the 10-day SMA, suggesting a potential bearish sentiment.
- MACD: The MACD line has been consistently below the signal line, indicating a bearish trend. However, the MACD histogram has shown some signs of convergence, hinting at a possible trend reversal.
Momentum Analysis:
- RSI: The RSI has been declining over the past few days, indicating weakening momentum. The current RSI value is below 50, suggesting a bearish momentum.
- Stochastic Oscillator: Both %K and %D have been decreasing, signaling a bearish momentum. The stock is currently oversold based on the stochastic indicators.
Volatility Analysis:
- Bollinger Bands (BB): The stock price has been moving within the Bollinger Bands, with the bands narrowing recently. This suggests decreasing volatility and a potential period of consolidation.
- Bollinger %B (BBP): The %B value is close to 0, indicating that the stock price is near the lower band. This could signal a potential bounce or reversal in the short term.
Volume Analysis:
- On-Balance Volume (OBV): The OBV has been declining, indicating selling pressure in the stock. The decreasing OBV suggests that more volume is associated with down days.
- Chaikin Money Flow (CMF): The CMF has been negative, indicating a lack of buying pressure in the stock. The negative CMF value suggests a bearish sentiment among investors.
Conclusion:
Based on the analysis of the technical indicators, the stock is currently in a bearish phase with weakening momentum, decreasing volume, and narrowing volatility. The trend indicators, momentum oscillators, and volume analysis all point towards a potential further downside in the stock price in the coming days. Traders and investors should exercise caution and consider waiting for more definitive signals of a trend reversal before considering long positions.