Technical Analysis of OBOR 2024-05-10
Overview:
In analyzing the technical indicators for the last 5 days of OBOR stock, we will delve into the trend, momentum, volatility, and volume indicators to provide a comprehensive outlook on the possible stock price movement in the coming days. By examining these key aspects, we aim to offer valuable insights and predictions to guide investment decisions.
Trend Indicators:
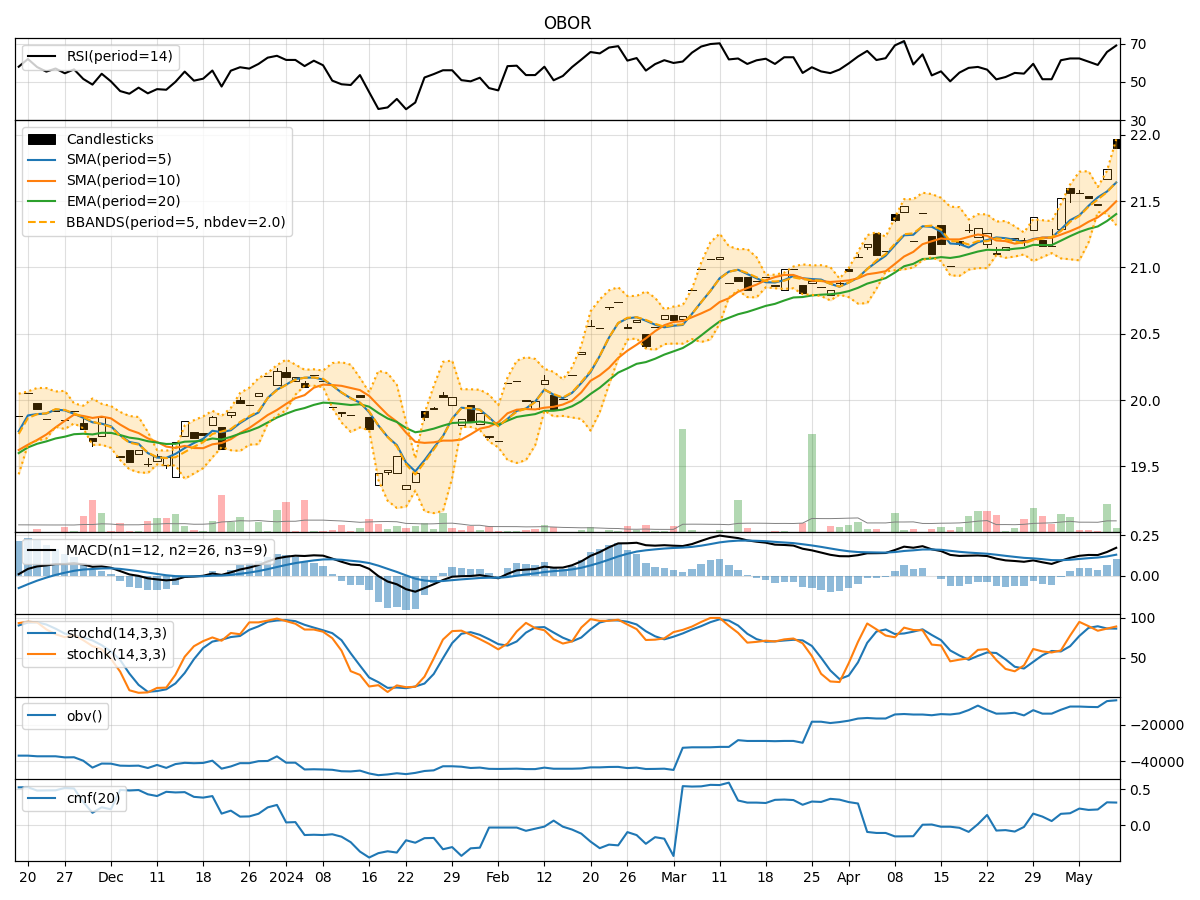
- Moving Averages (MA): The 5-day MA has been consistently above the closing prices, indicating a bullish trend.
- MACD: The MACD line has been steadily increasing, with the MACD histogram showing positive values, suggesting bullish momentum.
- EMA: The EMA has been trending upwards, supporting the bullish sentiment in the short term.
Momentum Indicators:
- RSI: The RSI has been fluctuating in the overbought territory, indicating strong buying pressure.
- Stochastic Oscillator: Both %K and %D have been in the overbought zone, signaling a potential reversal.
- Williams %R: The indicator has been hovering in the oversold region, suggesting a possible buying opportunity.
Volatility Indicators:
- Bollinger Bands: The stock price has been trading within the upper Bollinger Band, indicating an overbought condition.
- Bollinger Band Width: The Band Width has been narrowing, suggesting a potential decrease in volatility.
- Bollinger Band %B: The %B indicator has been above 0.8, indicating an overbought condition.
Volume Indicators:
- On-Balance Volume (OBV): The OBV has been increasing, reflecting strong buying volume.
- Chaikin Money Flow (CMF): The CMF has been positive, indicating buying pressure in the stock.
Key Observations and Opinions:
- Trend: The trend indicators suggest a strong bullish sentiment in the short term.
- Momentum: While momentum indicators show overbought conditions, the RSI and Stochastic Oscillator suggest a potential reversal or consolidation.
- Volatility: The narrowing Bollinger Bands and high %B indicate a possible decrease in volatility and a consolidation phase.
- Volume: The increasing OBV and positive CMF signal strong buying interest in the stock.
Conclusion:
Based on the analysis of the technical indicators, the next few days' possible stock price movement for OBOR stock is likely to experience a consolidation phase with a potential for a slight pullback. The bullish trend may continue, but the overbought conditions in momentum indicators suggest a need for caution. Traders should watch for signs of a reversal or consolidation before considering new positions.