Technical Analysis of OCEN 2024-05-10
Overview:
In analyzing the technical indicators for OCEN stock over the last 5 days, we will delve into the trend, momentum, volatility, and volume indicators to provide a comprehensive outlook on the possible future stock price movement. By examining these key indicators, we aim to offer valuable insights and predictions for the upcoming trading days.
Trend Indicators:
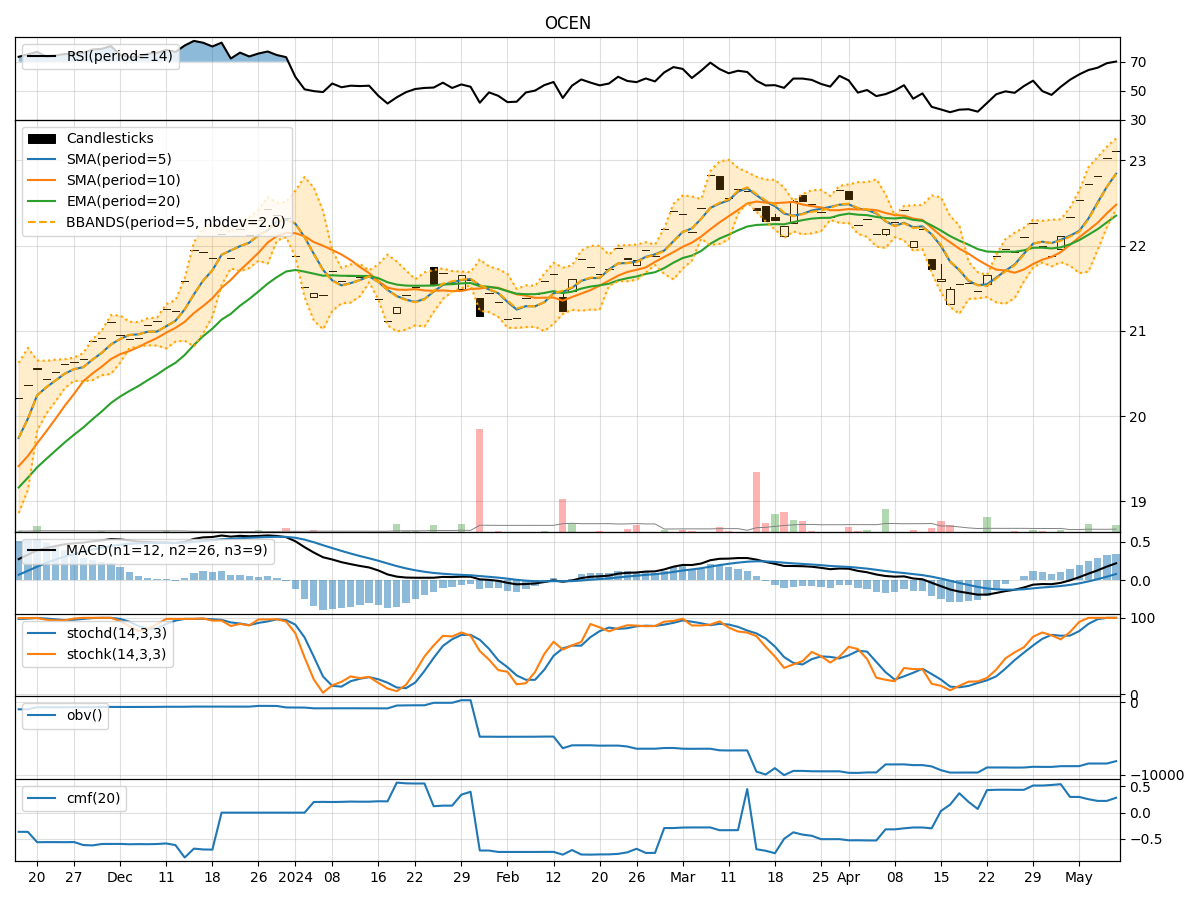
- Moving Averages (MA): The 5-day Moving Average (MA) has been consistently above the Simple Moving Average (SMA) and Exponential Moving Average (EMA), indicating a bullish trend.
- MACD: The MACD line has been above the signal line, with both lines showing an upward trend, suggesting bullish momentum.
- MACD Histogram: The MACD Histogram has been increasing, indicating strengthening bullish momentum.
Momentum Indicators:
- RSI: The Relative Strength Index (RSI) has been trending upwards and is currently in the overbought territory, suggesting a strong bullish momentum.
- Stochastic Oscillator: Both %K and %D lines of the Stochastic Oscillator are at 100, indicating strong buying pressure.
- Williams %R: The Williams %R is at 0, signaling an overbought condition.
Volatility Indicators:
- Bollinger Bands: The stock price has been trading within the Bollinger Bands, with the bands widening slightly, indicating increased volatility.
- Bollinger %B: The %B indicator is below 1, suggesting that the stock price is trading below the upper Bollinger Band.
Volume Indicators:
- On-Balance Volume (OBV): The OBV has been decreasing over the last 5 days, indicating a slight decrease in buying pressure.
- Chaikin Money Flow (CMF): The CMF has been positive but trending downwards, suggesting a potential decrease in buying pressure.
Key Observations and Opinions:
- Trend: The trend indicators point towards a strong bullish trend in the stock.
- Momentum: Momentum indicators indicate a high level of buying pressure and bullish momentum.
- Volatility: Volatility has slightly increased, potentially leading to larger price swings.
- Volume: While the OBV has decreased, the CMF still shows positive buying pressure.
Conclusion:
Based on the analysis of the technical indicators, the next few days' possible stock price movement for OCEN is likely to continue in an upward direction. The bullish trend, strong momentum, and positive buying pressure suggest that the stock price may experience further gains. Traders and investors could consider buying opportunities in anticipation of potential price appreciation. It is essential to monitor the indicators closely for any signs of reversal or consolidation in the market.