Technical Analysis of OCTH 2024-05-10
Overview:
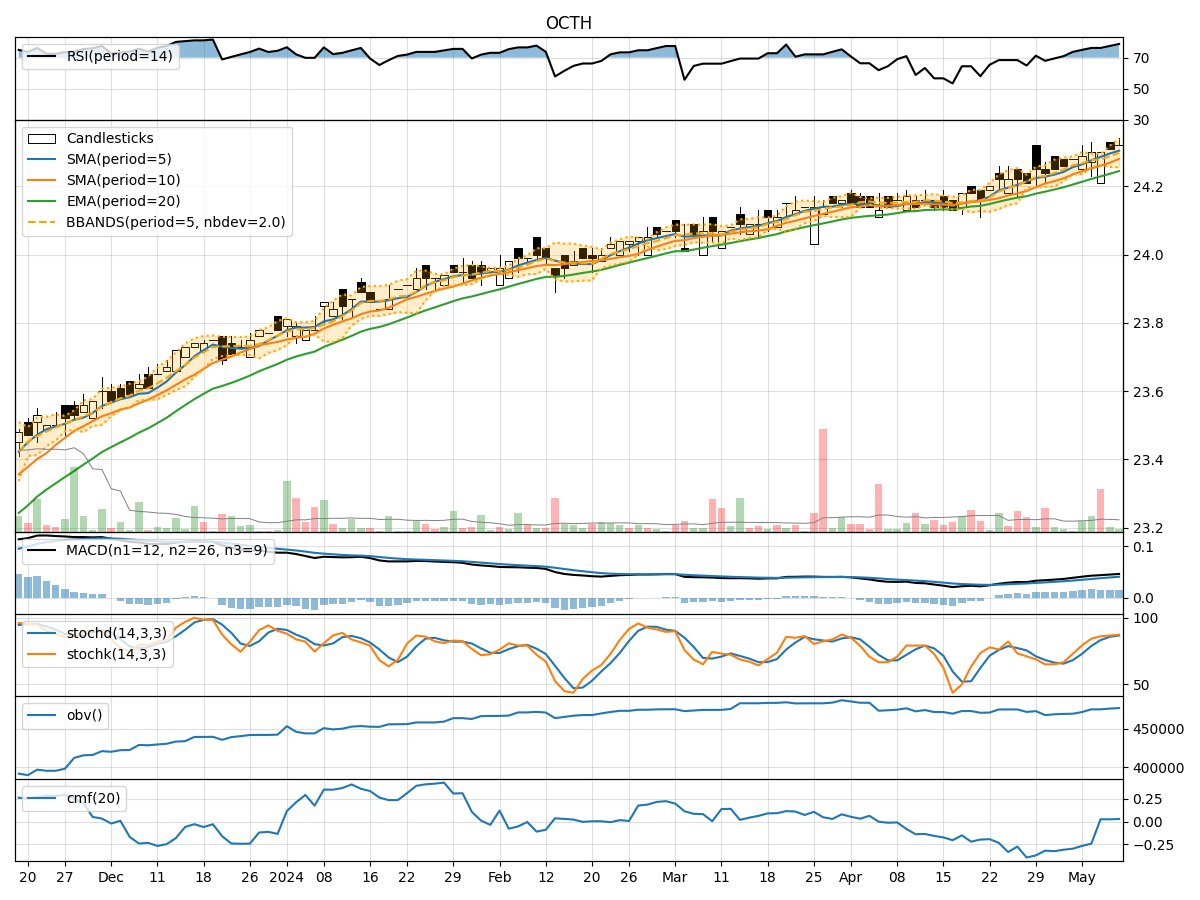
In analyzing the technical indicators for OCTH over the last 5 days, we will delve into the trend, momentum, volatility, and volume indicators to provide a comprehensive assessment of the stock's potential price movement. By examining these key factors, we aim to offer valuable insights and predictions for the next few days.
Trend Analysis:
- Moving Averages (MA): The 5-day MA has been consistently above the closing price, indicating a short-term uptrend.
- MACD: The MACD line has been steadily increasing, with the MACD histogram showing positive values, suggesting bullish momentum.
- EMA: The EMA has been trending upwards, reflecting a positive price trend.
Key Observation: The trend indicators point towards a bullish sentiment in the short term.
Momentum Analysis:
- RSI: The RSI values have been increasing, reaching overbought levels, indicating strong buying momentum.
- Stochastic Oscillator: Both %K and %D values are in the overbought zone, signaling potential price strength.
- Williams %R: The indicator is in the oversold region, suggesting a potential reversal.
Key Observation: Momentum indicators suggest a bullish momentum in the stock.
Volatility Analysis:
- Bollinger Bands (BB): The stock price has been trading within the upper Bollinger Band, indicating increased volatility.
- Bollinger Band Width: The band width has widened, suggesting higher price fluctuations.
- Bollinger Band %B: The %B indicator is above 0.8, indicating an overbought condition.
Key Observation: Volatility indicators imply an increased volatility in the stock price.
Volume Analysis:
- On-Balance Volume (OBV): The OBV has shown mixed movements, indicating indecision among investors.
- Chaikin Money Flow (CMF): The CMF has been fluctuating around the zero line, reflecting a neutral money flow.
Key Observation: Volume indicators suggest a lack of clear direction in terms of investor sentiment.
Conclusion:
Based on the analysis of trend, momentum, volatility, and volume indicators, the overall outlook for OCTH in the next few days appears to be bullish. The trend indicators, momentum signals, and volatility metrics all point towards a potential upward movement in the stock price. However, the mixed signals from volume indicators indicate a degree of uncertainty in investor sentiment.
Key Conclusion: The stock is likely to experience upward momentum in the coming days, but investors should closely monitor volume trends for confirmation of sustained buying interest.