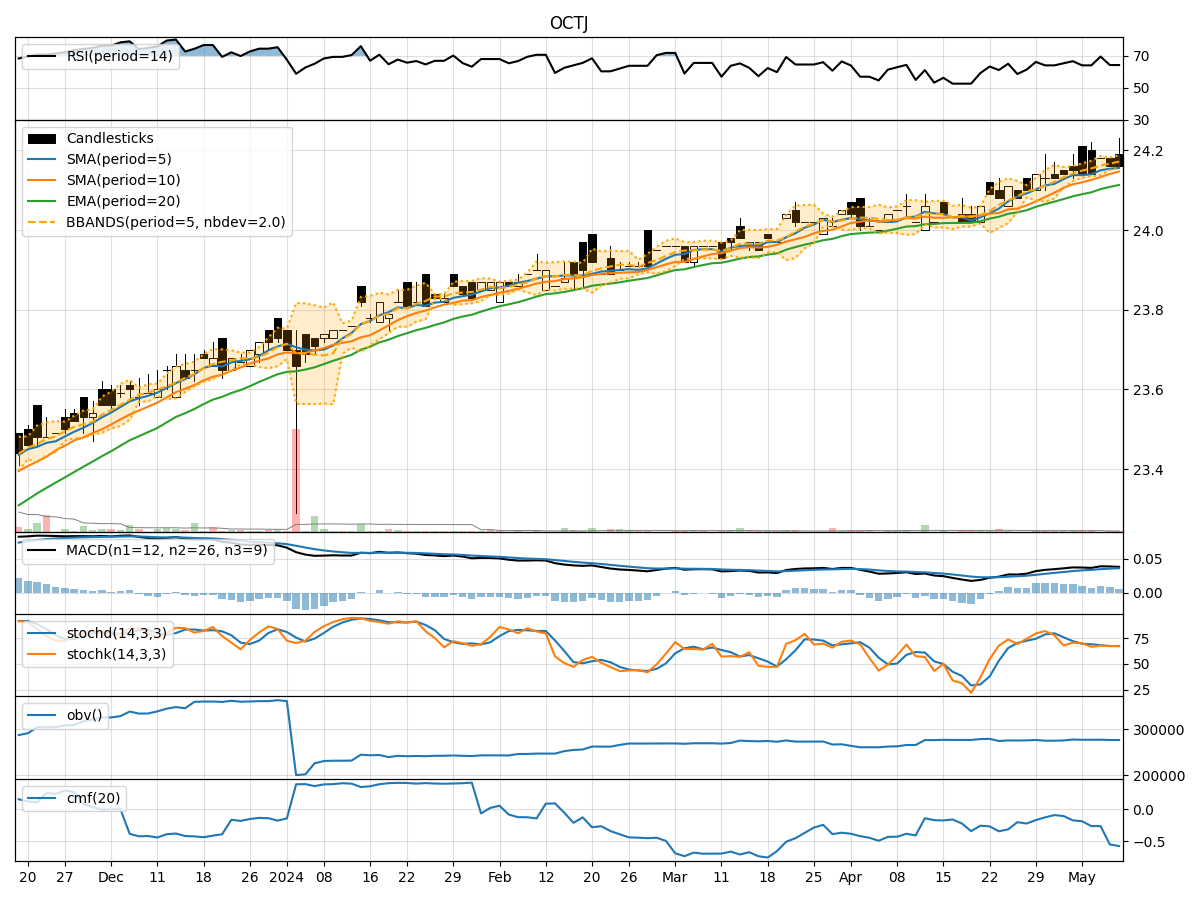
Technical Analysis of OCTJ 2024-05-10
Overview:
In analyzing the technical indicators for OCTJ stock over the last 5 days, we will delve into the trends, momentum, volatility, and volume aspects to provide a comprehensive outlook. By examining these key indicators, we aim to forecast the potential price movement for the upcoming days.
Trend Analysis:
- Moving Averages (MA): The 5-day Moving Average (MA) has been relatively stable around the closing prices, indicating a consistent trend.
- MACD: The Moving Average Convergence Divergence (MACD) has shown a slight positive trend, with the MACD line consistently above the signal line.
- EMA: The Exponential Moving Average (EMA) has been gradually increasing, suggesting a bullish sentiment in the short to medium term.
Momentum Analysis:
- RSI: The Relative Strength Index (RSI) has been fluctuating around the neutral zone, indicating a balanced momentum between buying and selling pressure.
- Stochastic Oscillator: Both %K and %D lines of the Stochastic Oscillator have been hovering around the mid-range, reflecting a lack of strong momentum in either direction.
Volatility Analysis:
- Bollinger Bands (BB): The Bollinger Bands have shown a narrowing of the bands, suggesting decreasing volatility in the stock price.
- Bollinger %B: The %B indicator has remained relatively stable around the middle range, indicating a neutral stance in terms of volatility.
Volume Analysis:
- On-Balance Volume (OBV): The OBV indicator has shown a slight decline, indicating a decrease in buying volume over the past few days.
- Chaikin Money Flow (CMF): The CMF has been consistently negative, signaling a bearish sentiment in terms of volume flow.
Conclusion:
Based on the analysis of the technical indicators, the stock price of OCTJ is likely to experience sideways movement in the upcoming days. The stable moving averages, neutral momentum indicators, decreasing volatility, and bearish volume sentiment suggest a lack of clear direction in the short term. Traders may expect the stock to consolidate within a narrow range without significant price fluctuations. It is advisable to closely monitor key support and resistance levels for potential breakout opportunities in the future.