Technical Analysis of ODDS 2024-05-10
Overview:
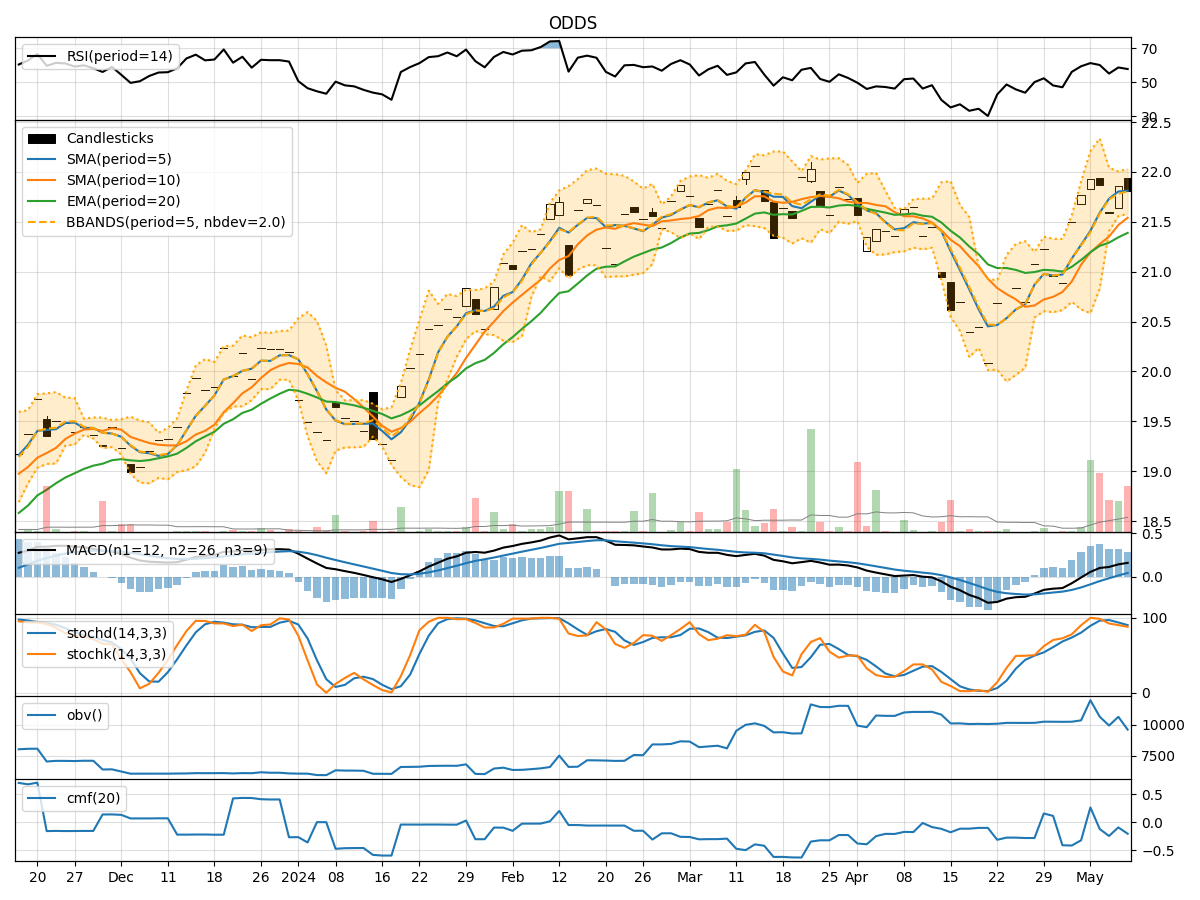
In the last 5 trading days, the stock has shown mixed signals across various technical indicators. The trend indicators suggest a slightly bullish sentiment, with the moving averages trending upwards. Momentum indicators show a slight decline in strength, while volatility indicators indicate a narrowing of price range. Volume indicators reflect a decrease in buying pressure.
Trend Indicators:
- Moving Averages (MA): The 5-day MA has been consistently above the 10-day SMA, indicating a short-term bullish trend. The EMA(20) has been trending upwards, supporting a bullish sentiment.
- MACD: The MACD line has been above the signal line, indicating bullish momentum. However, the MACD histogram has been decreasing, suggesting a potential weakening of the bullish momentum.
Momentum Indicators:
- RSI: The RSI has been fluctuating around the 50 level, indicating a lack of strong momentum in either direction.
- Stochastic Oscillator: Both %K and %D have been declining, suggesting a potential shift towards oversold conditions. The Williams %R is also indicating an oversold condition.
Volatility Indicators:
- Bollinger Bands (BB): The bands have been narrowing, indicating decreasing volatility and a potential upcoming breakout or breakdown.
- Bollinger %B: The %B is hovering around the middle range, suggesting a lack of clear direction in price movement.
Volume Indicators:
- On-Balance Volume (OBV): The OBV has been declining, indicating a decrease in buying pressure over the last few days.
- Chaikin Money Flow (CMF): The CMF has been negative, indicating a lack of strong buying interest.
Conclusion:
Based on the analysis of the technical indicators, the stock is currently in a sideways consolidation phase with a slightly bullish bias. The trend indicators suggest a potential continuation of the short-term bullish trend, supported by the moving averages and MACD. However, the momentum indicators show a lack of strong buying momentum, and the volatility indicators indicate a potential breakout or breakdown in the near future.
Considering the overall picture, it is advisable to exercise caution and closely monitor the price action in the coming days. Traders may consider waiting for a clear breakout above key resistance levels or breakdown below support levels before taking any significant positions. Long-term investors may hold their positions but remain vigilant for any signs of a trend reversal.
In conclusion, the stock is currently in a consolidation phase with a slight bullish bias, and further price action observation is recommended to determine the next significant move.