Technical Analysis of OFOS 2024-05-10
Overview:
In analyzing the technical indicators for OFOS stock over the last 5 days, we will delve into the trends, momentum, volatility, and volume aspects to provide a comprehensive outlook on the possible stock price movement in the coming days. By examining key indicators such as moving averages, MACD, RSI, Bollinger Bands, and OBV, we aim to offer valuable insights and predictions for potential price action.
Trend Indicators:
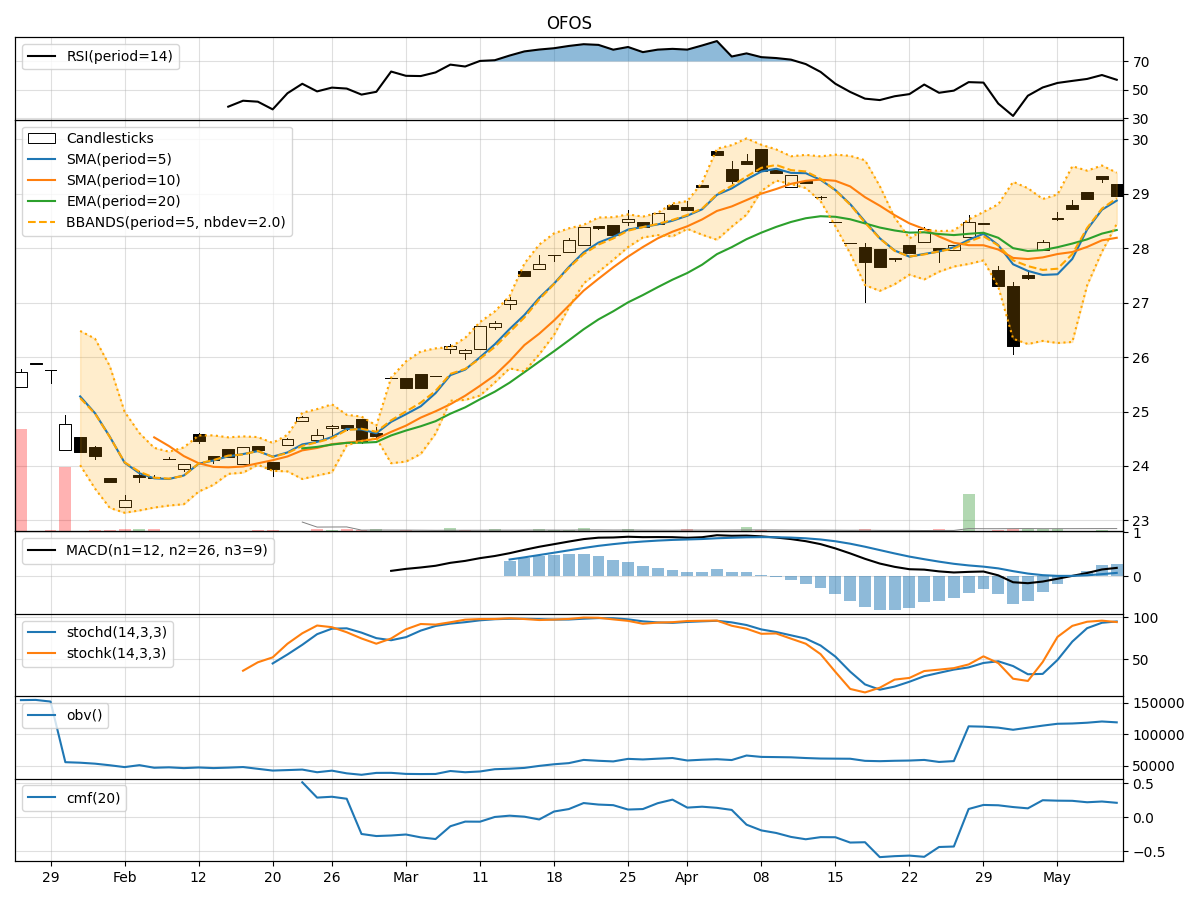
- Moving Averages (MA): The 5-day moving average has been consistently above the longer-term SMAs, indicating a short-term bullish trend.
- MACD: The MACD line has been above the signal line, with both showing positive values, suggesting bullish momentum.
- EMA: The EMA has been trending upwards, reflecting a positive price trend.
Momentum Indicators:
- RSI: The RSI has been in the neutral to slightly overbought territory, indicating moderate buying pressure.
- Stochastic Oscillator: Both %K and %D have been in the overbought zone, signaling potential for a pullback.
- Williams %R: The indicator has been in the oversold region, suggesting a possible reversal.
Volatility Indicators:
- Bollinger Bands: The price has mostly stayed within the bands, indicating normal volatility.
- Bollinger %B: The %B has fluctuated within a reasonable range, showing no extreme conditions.
Volume Indicators:
- On-Balance Volume (OBV): The OBV has shown a slight increase, indicating some accumulation.
- Chaikin Money Flow (CMF): The CMF has been positive, suggesting buying pressure.
Key Observations:
- The trend indicators point towards a bullish sentiment in the short term.
- Momentum indicators show a mix of buying pressure and potential for a pullback.
- Volatility remains stable with no significant spikes.
- Volume indicators indicate some accumulation and positive money flow.
Conclusion:
Based on the analysis of the technical indicators, the stock is likely to continue its upward trend in the next few days. The bullish trend supported by moving averages and MACD, along with positive volume indicators, suggests further price appreciation. However, caution is advised as momentum indicators signal potential overbought conditions, and a pullback or consolidation phase could occur. Traders should monitor key support and resistance levels for timely decision-making.