Technical Analysis of OILK 2024-05-10
Overview:
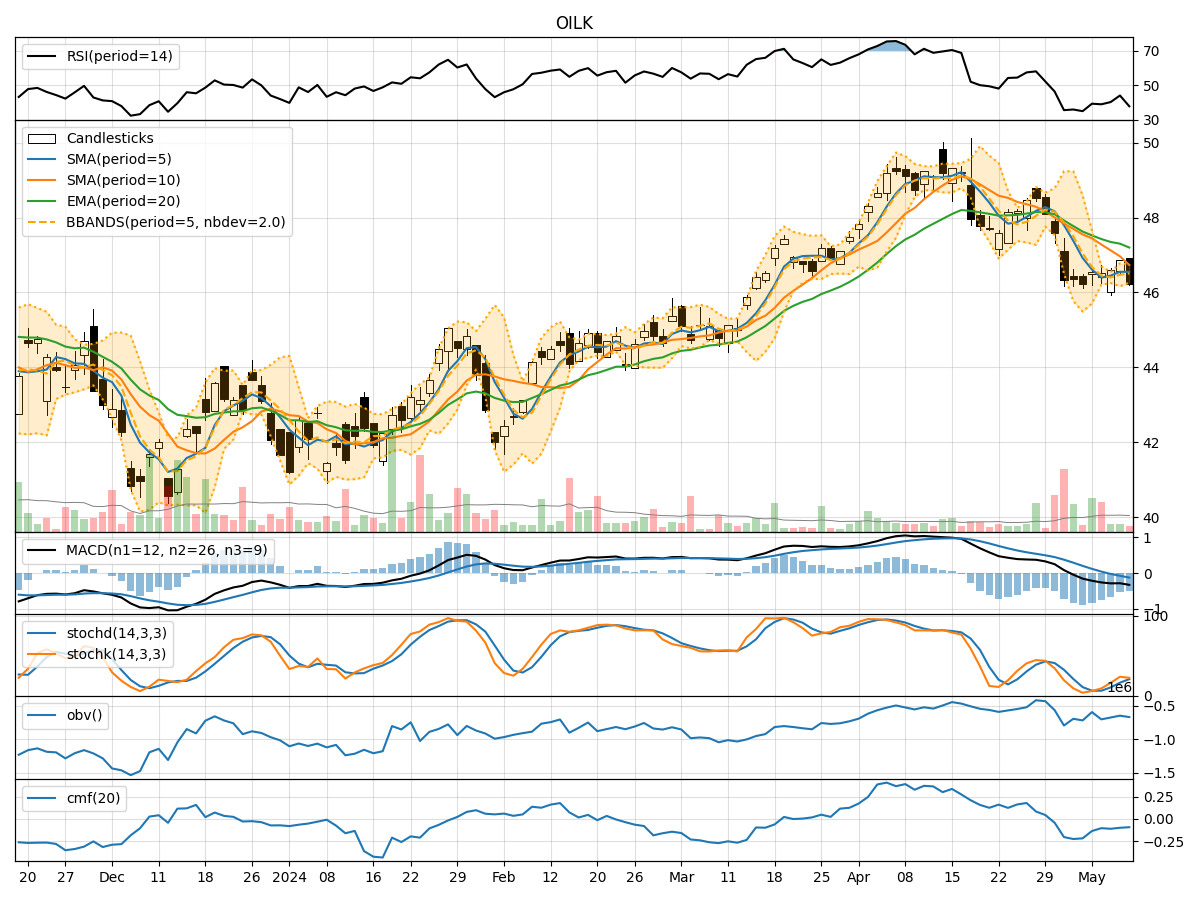
In analyzing the technical indicators for OILK over the last 5 days, we will delve into the trend, momentum, volatility, and volume indicators to provide a comprehensive assessment of the stock's potential price movement. By examining these key factors, we aim to offer valuable insights and predictions for the next few days.
Trend Analysis:
- Moving Averages (MA): The 5-day MA has been fluctuating around the closing prices, indicating a lack of clear trend direction.
- MACD: The MACD line has been consistently below the signal line, suggesting a bearish momentum in the short term.
- EMA: The EMA has been gradually declining, reflecting a downward trend in the stock price.
Key Observation: The trend indicators point towards a bearish sentiment in the short term.
Momentum Analysis:
- RSI: The RSI has been hovering around the mid-range, indicating a neutral momentum.
- Stochastic Oscillator: Both %K and %D have shown mixed signals, with %K crossing %D, suggesting potential reversal points.
- Williams %R: The Williams %R has been in oversold territory, indicating a possible buying opportunity.
Key Observation: The momentum indicators suggest a neutral to slightly bullish sentiment.
Volatility Analysis:
- Bollinger Bands (BB): The stock price has been trading within the bands, with the bands narrowing, indicating decreasing volatility.
- Bollinger %B: The %B has been fluctuating around 0.5, suggesting a balanced market sentiment.
Key Observation: Volatility indicators signal a sideways movement with a potential for a breakout.
Volume Analysis:
- On-Balance Volume (OBV): The OBV has shown a slight increase, indicating some accumulation by investors.
- Chaikin Money Flow (CMF): The CMF has been negative, suggesting a net outflow of money from the stock.
Key Observation: Volume indicators reflect a mixed sentiment with a slight bias towards selling pressure.
Conclusion:
Based on the analysis of the technical indicators, the next few days' possible stock price movement for OILK is likely to be sideways with a slight bearish bias. While momentum indicators show a neutral to slightly bullish stance, trend indicators point towards a bearish sentiment. Volatility indicators suggest a potential breakout, and volume indicators indicate a mixed sentiment with selling pressure.
Key Conclusion: The overall outlook for OILK in the next few days leans towards a sideways movement with a bearish bias, with potential for a breakout depending on market dynamics and external factors.