Technical Analysis of OMFL 2024-05-10
Overview:
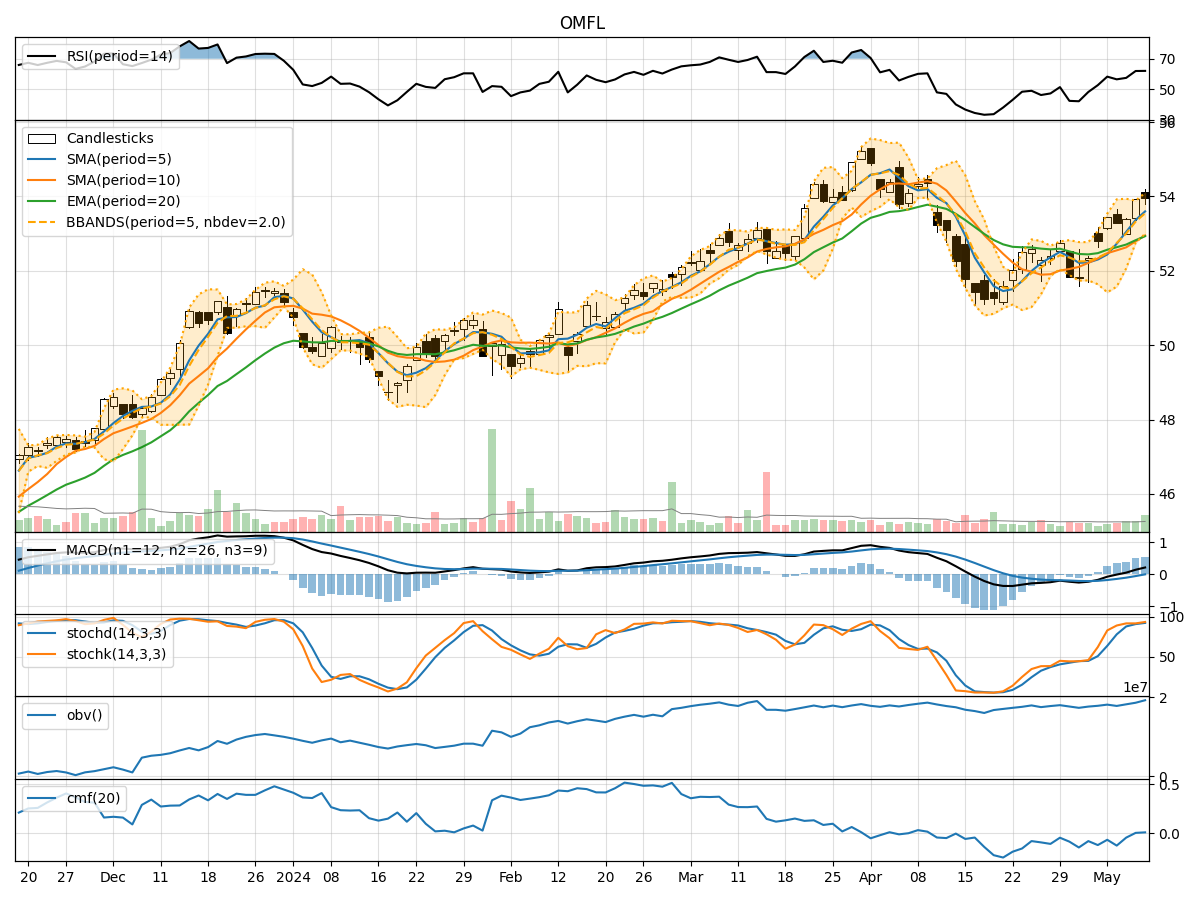
In analyzing the technical indicators for OMFL over the last 5 days, we will delve into the trend, momentum, volatility, and volume indicators to provide a comprehensive outlook on the possible stock price movement. By examining these key aspects, we aim to offer valuable insights and predictions for the upcoming days.
Trend Analysis:
- Moving Averages (MA): The 5-day Moving Average has been consistently rising, indicating a bullish trend in the short term.
- MACD: The MACD line has been above the signal line for the past few days, suggesting positive momentum in the stock price.
- EMA: The Exponential Moving Average has been trending upwards, supporting the bullish sentiment in the stock.
Key Observation: The trend indicators point towards a bullish outlook for OMFL.
Momentum Analysis:
- RSI: The Relative Strength Index has been increasing, reaching levels above 50, indicating strengthening momentum.
- Stochastic Oscillator: Both %K and %D have been in the overbought zone, suggesting a potential reversal or consolidation.
- Williams %R: The indicator has been fluctuating around the oversold and overbought levels, signaling mixed momentum.
Key Observation: Momentum indicators show a mixed sentiment, with some suggesting overbought conditions.
Volatility Analysis:
- Bollinger Bands: The bands have been widening, indicating increased volatility in the stock price.
- Bollinger %B: The %B indicator has been fluctuating within the bands, reflecting the volatility in the price movements.
Key Observation: Volatility indicators suggest increased volatility in the stock.
Volume Analysis:
- On-Balance Volume (OBV): The OBV has been increasing, indicating accumulation of the stock.
- Chaikin Money Flow (CMF): The CMF has been fluctuating around the zero line, suggesting neutral money flow.
Key Observation: Volume indicators point towards positive accumulation in the stock.
Conclusion:
Based on the analysis of the technical indicators, the overall outlook for OMFL in the next few days is bullish. The trend indicators support a continued upward movement, while momentum indicators show a mixed sentiment with potential for consolidation. Volatility is expected to remain high, indicating significant price fluctuations. Volume indicators suggest positive accumulation, supporting the bullish view.
Recommendation:
Considering the bullish trend and positive volume accumulation, investors may consider buying OMFL for potential short to medium-term gains. However, it is essential to monitor the momentum indicators for any signs of reversal or consolidation. Traders should set appropriate stop-loss levels to manage risk effectively.