Technical Analysis of OND 2024-05-10
Overview:
In analyzing the technical indicators for the stock over the last 5 days, we will delve into the trend, momentum, volatility, and volume indicators to provide a comprehensive assessment of the possible future stock price movement. By examining these key indicators, we aim to offer valuable insights and predictions for the upcoming trading days.
Trend Indicators:
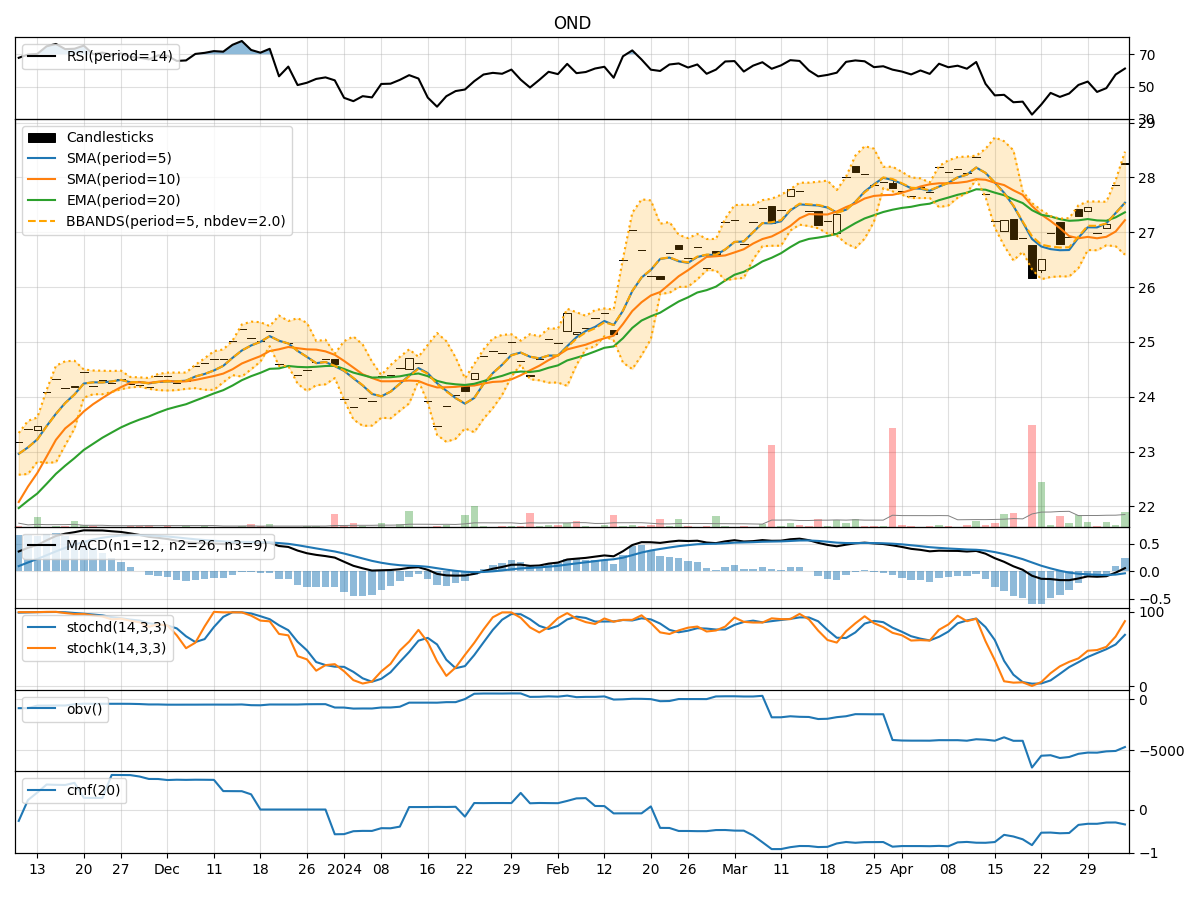
- Moving Averages (MA): The 5-day Moving Average (MA) has been consistently above the Simple Moving Average (SMA) and Exponential Moving Average (EMA) over the past 5 days, indicating a bullish trend.
- MACD: The Moving Average Convergence Divergence (MACD) has shown positive values, with the MACD line consistently above the Signal line, suggesting bullish momentum.
Momentum Indicators:
- RSI: The Relative Strength Index (RSI) has been fluctuating around the 50 level, indicating a neutral momentum in the stock.
- Stochastic Oscillator: Both %K and %D have been declining, suggesting a potential bearish momentum in the short term.
Volatility Indicators:
- Bollinger Bands (BB): The stock price has been trading within the Bollinger Bands, with the bands narrowing, indicating decreasing volatility.
Volume Indicators:
- On-Balance Volume (OBV): The OBV has been negative, indicating a net selling pressure in the stock.
- Chaikin Money Flow (CMF): The CMF has been consistently negative, reflecting a bearish sentiment in the stock.
Key Observations and Opinions:
- Trend: The stock is currently in an upward trend based on the Moving Averages and MACD indicators.
- Momentum: The momentum indicators suggest a neutral to bearish bias in the short term.
- Volatility: Volatility has been decreasing, potentially signaling a period of consolidation.
- Volume: The negative OBV and CMF indicate selling pressure in the stock.
Conclusion:
Based on the analysis of the technical indicators, the stock is likely to experience further consolidation in the upcoming trading days. The bullish trend indicated by the Moving Averages and MACD may face resistance due to the bearish momentum highlighted by the Stochastic Oscillator. The decreasing volatility suggests a period of stability, while the negative volume indicators point towards continued selling pressure. Therefore, the stock is expected to trade sideways with a bearish bias in the near term. Investors should closely monitor key support and resistance levels for potential entry or exit points.