Technical Analysis of ONEQ 2024-05-10
Overview:
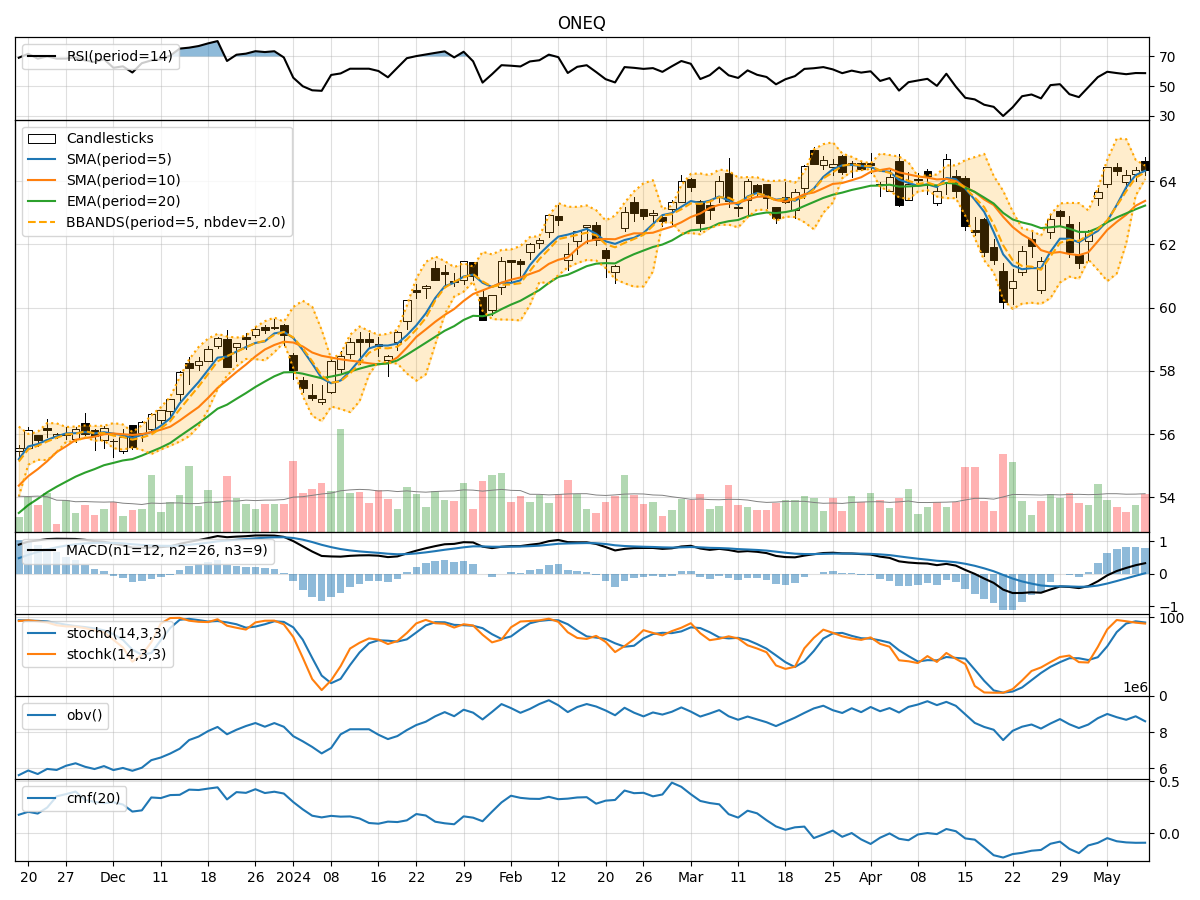
In the last 5 trading days, ONEQ has shown a relatively stable price movement with minor fluctuations. The trend indicators suggest a gradual uptrend, supported by moving averages and MACD signals. Momentum indicators indicate a slightly overbought condition but still within a bullish territory. Volatility indicators show a narrowing Bollinger Bands, indicating decreasing volatility. Volume indicators suggest a slight decrease in buying pressure.
Trend Indicators:
- Moving Averages (MA): The 5-day MA has been consistently above the longer-term SMAs, indicating a short-term uptrend.
- MACD: The MACD line has been above the signal line, indicating a bullish momentum.
- Conclusion: The trend indicators suggest an upward trend in the stock price.
Momentum Indicators:
- RSI: The RSI is in the overbought territory but not at extreme levels, suggesting a strong bullish momentum.
- Stochastic Oscillator: Both %K and %D are in the overbought zone, indicating a potential reversal.
- Conclusion: The momentum indicators suggest a slight caution as the stock may be overbought.
Volatility Indicators:
- Bollinger Bands (BB): The bands are narrowing, indicating decreasing volatility and a potential consolidation phase.
- Conclusion: The volatility indicators suggest a sideways or consolidation phase in the stock price.
Volume Indicators:
- On-Balance Volume (OBV): The OBV has shown a slight decrease, indicating a decrease in buying pressure.
- Chaikin Money Flow (CMF): The CMF is negative, suggesting a slight bearish sentiment.
- Conclusion: The volume indicators suggest a slight decrease in buying pressure.
Conclusion:
Based on the analysis of the technical indicators, the next few days' possible stock price movement for ONEQ is likely to be sideways or in a consolidation phase. The trend indicators support an upward bias, while momentum indicators signal a potential overbought condition. Volatility indicators point towards decreasing volatility, possibly leading to a period of consolidation. Volume indicators indicate a slight decrease in buying pressure, supporting the view of a sideways movement.
Recommendation:
- Short-term Traders: Consider taking profits or tightening stop-loss levels due to the overbought momentum signals.
- Long-term Investors: Monitor the price action for a potential consolidation phase to accumulate more shares at lower levels.
- Risk Management: Implement proper risk management strategies to navigate potential price fluctuations during the consolidation phase.
Overall Sentiment:
The overall sentiment for ONEQ in the next few days is neutral to slightly bearish, with a higher probability of sideways movement or consolidation. It is essential to monitor key support and resistance levels for potential breakout or breakdown scenarios.