Technical Analysis of ONEV 2024-05-10
Overview:
In analyzing the technical indicators for ONEV over the last 5 days, we will delve into the trend, momentum, volatility, and volume indicators to provide a comprehensive outlook on the possible stock price movement in the coming days. By examining these key indicators, we aim to offer valuable insights and predictions for potential investors.
Trend Analysis:
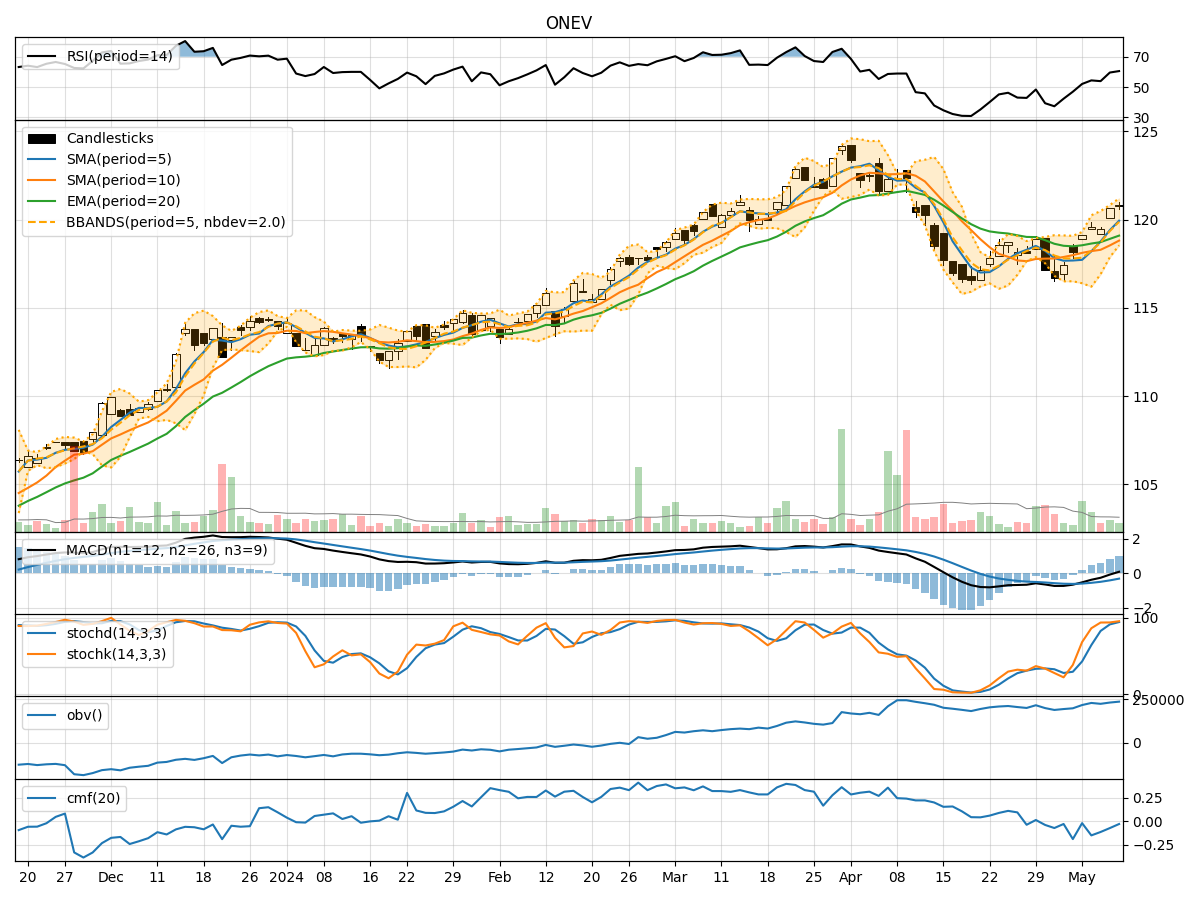
- Moving Averages (MA): The 5-day MA has been consistently above the 10-day SMA, indicating a short-term bullish trend. The EMA(20) has shown a gradual uptrend, suggesting positive momentum in the stock price.
- MACD: The MACD line has been above the signal line for the past 5 days, indicating a bullish trend. The MACD histogram has been steadily increasing, further supporting the bullish momentum.
Momentum Analysis:
- RSI: The RSI has been trending upwards and is currently in the neutral zone, suggesting potential room for further upside movement.
- Stochastic Oscillator: Both %K and %D lines are in the overbought territory, indicating a strong bullish momentum. However, caution is advised as the stock may be overextended in the short term.
Volatility Analysis:
- Bollinger Bands (BB): The stock price has been trading within the upper Bollinger Band, indicating an overbought condition. The bands are relatively narrow, suggesting a period of low volatility.
- Bollinger %B: The %B indicator is below 1, indicating that the stock price is trading above the upper band, signaling a potential overbought situation.
Volume Analysis:
- On-Balance Volume (OBV): The OBV has shown a slight increase over the past 5 days, indicating some accumulation by investors. However, the overall trend is relatively flat, suggesting neutral volume flow.
- Chaikin Money Flow (CMF): The CMF(20) is negative, indicating that money is flowing out of the stock. This suggests a bearish sentiment in terms of volume.
Conclusion:
Based on the technical analysis of ONEV: - Trend: The stock is in a strong bullish trend based on moving averages and MACD. - Momentum: The momentum indicators suggest a short-term overbought condition, cautioning against potential pullback or consolidation. - Volatility: The stock is currently in an overbought state based on Bollinger Bands, indicating a possible reversal or correction. - Volume: The volume indicators show a neutral to slightly bearish sentiment, with money flowing out of the stock.
Overall View:
Considering the technical indicators and analysis, the next few days for ONEV may see a potential pullback or consolidation after the recent bullish run. Investors should exercise caution and wait for a clearer signal before making any significant trading decisions.