Technical Analysis of ONEY 2024-05-10
Overview:
In analyzing the technical indicators for ONEY stock over the last 5 days, we will delve into the trend, momentum, volatility, and volume indicators to provide a comprehensive outlook on the possible stock price movement in the coming days. By examining these key aspects, we aim to offer valuable insights and predictions to guide your investment decisions.
Trend Analysis:
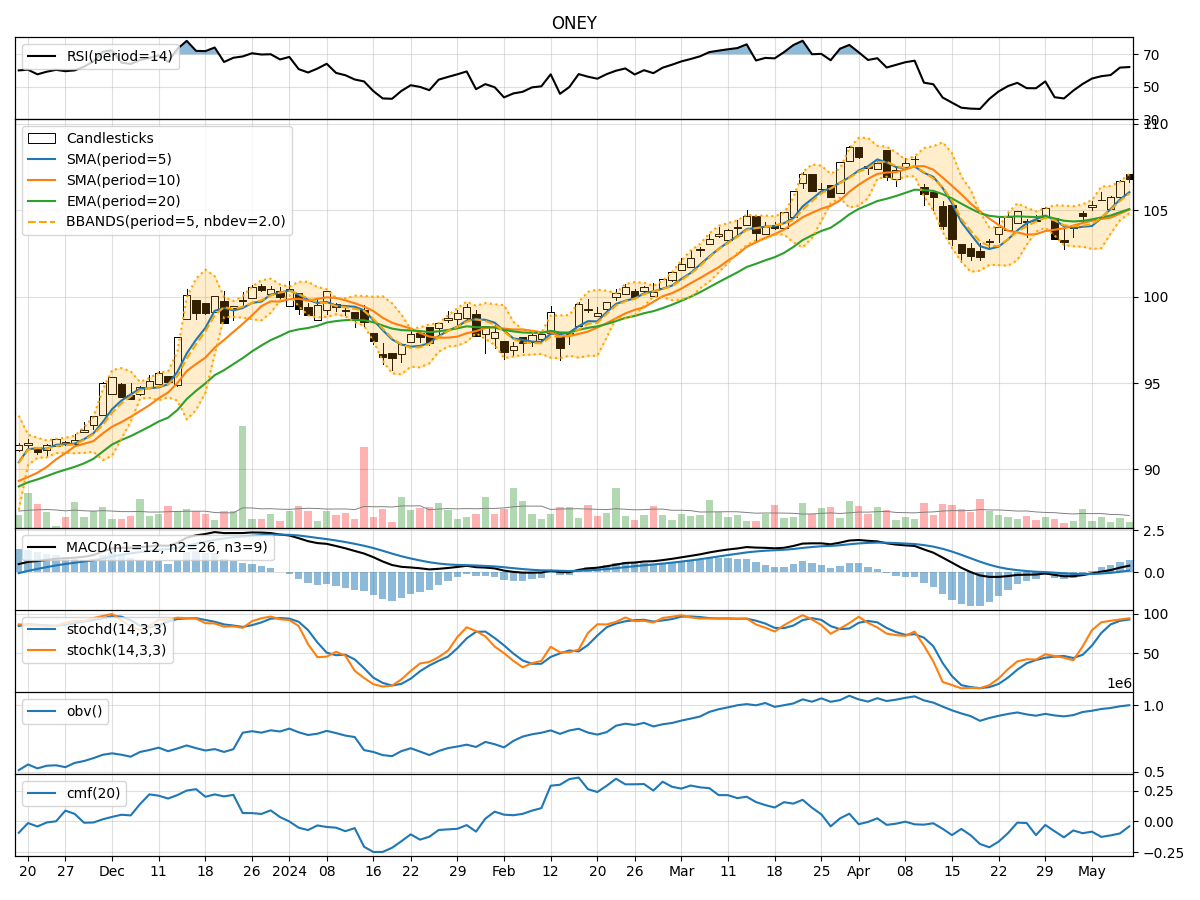
- Moving Averages (MA): The 5-day Moving Average (MA) has been consistently trending upwards, indicating a positive momentum in the stock price.
- MACD: The Moving Average Convergence Divergence (MACD) has shown an increasing trend, with the MACD line crossing above the signal line, suggesting a bullish signal.
- EMA: The Exponential Moving Average (EMA) has also been on an upward trajectory, supporting the bullish outlook for the stock.
Momentum Analysis:
- RSI: The Relative Strength Index (RSI) has been gradually increasing, reaching levels above 60, indicating strengthening momentum.
- Stochastic Oscillator: Both %K and %D lines of the Stochastic Oscillator are in the overbought zone, suggesting a potential reversal or consolidation in the near term.
- Williams %R: The Williams %R indicator is in the oversold territory, signaling a possible correction or pullback.
Volatility Analysis:
- Bollinger Bands: The Bollinger Bands have been narrowing, indicating decreasing volatility in the stock price.
- Bollinger %B: The %B indicator is hovering around 0.8, suggesting that the stock is trading near the upper band, potentially indicating an overbought condition.
Volume Analysis:
- On-Balance Volume (OBV): The OBV indicator has been steadily increasing, reflecting positive buying pressure in the stock.
- Chaikin Money Flow (CMF): The CMF has been negative, indicating some distribution in the stock despite the rising OBV.
Conclusion:
Based on the analysis of the technical indicators, the stock of ONEY is currently exhibiting bullish tendencies in terms of trend and momentum. However, the overbought signals from the Stochastic Oscillator and potential overbought condition indicated by the Bollinger %B suggest a possible consolidation or pullback in the near future. The positive OBV and increasing RSI support the bullish outlook, but caution is advised due to the mixed signals from the volatility indicators.
In conclusion, while the overall trend is upward, investors should closely monitor the stock for signs of a short-term correction or sideways movement before considering entry points. It is essential to combine technical analysis with fundamental research to make well-informed investment decisions.