Technical Analysis of OOTO 2024-05-10
Overview:
In analyzing the provided Technical Analysis (TA) data for the last 5 days, we will delve into the trend, momentum, volatility, and volume indicators to forecast the possible stock price movement for the next few days. By examining these key indicators, we aim to provide a comprehensive and insightful prediction backed by data-driven analysis.
Trend Analysis:
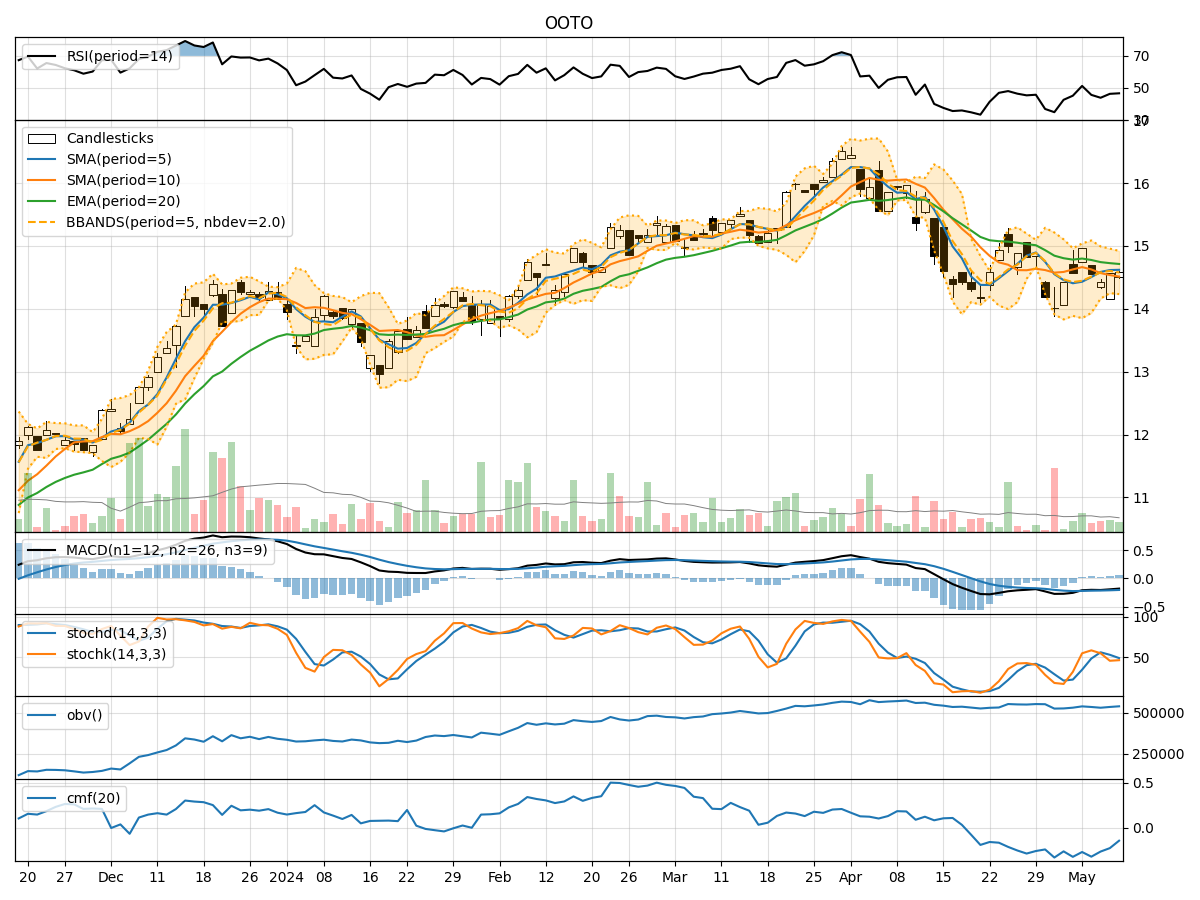
- Moving Averages (MA): The 5-day Moving Average (MA) has been fluctuating around the closing prices, indicating a lack of clear trend direction.
- MACD and Signal Line: The MACD line has been consistently below the Signal line, suggesting a bearish momentum in the short term.
- Relative Strength Index (RSI): The RSI values have been hovering around the mid-range, indicating a neutral sentiment without a strong bullish or bearish bias.
Momentum Analysis:
- Stochastic Oscillator: The Stochastic Oscillator has been fluctuating within a range, not showing any extreme overbought or oversold conditions.
- Williams %R (Willr): The Williams %R values have been negative but not at extreme levels, indicating a potential for a reversal.
Volatility Analysis:
- Bollinger Bands (BB): The Bollinger Bands have been narrowing, suggesting decreasing volatility in the stock price.
- Bollinger Band %B (bbp): The %B values have been relatively stable, indicating a lack of significant price movement.
Volume Analysis:
- On-Balance Volume (OBV): The OBV values have shown a slight increase, indicating some buying pressure in the stock.
- Chaikin Money Flow (CMF): The CMF values have been negative, suggesting a net outflow of money from the stock.
Conclusion:
Based on the analysis of the technical indicators: - The stock is currently in a sideways consolidation phase with no clear trend direction. - The momentum indicators suggest a neutral sentiment with no extreme overbought or oversold conditions. - Volatility is decreasing, indicating a potential period of stability in the stock price. - The volume indicators show a slight increase in buying pressure but overall negative money flow.
Forecast:
Given the current technical indicators and market conditions, the stock is likely to continue trading in a sideways range with limited price movement in the next few days. Traders and investors should exercise caution and wait for clearer signals of a trend before making significant trading decisions.