Technical Analysis of OSEA 2024-05-10
Overview:
In analyzing the technical indicators for OSEA stock over the last 5 days, we will delve into the trend, momentum, volatility, and volume indicators to provide a comprehensive outlook on the possible stock price movement in the coming days. By examining these key indicators, we aim to offer valuable insights and predictions for potential investors.
Trend Indicators:
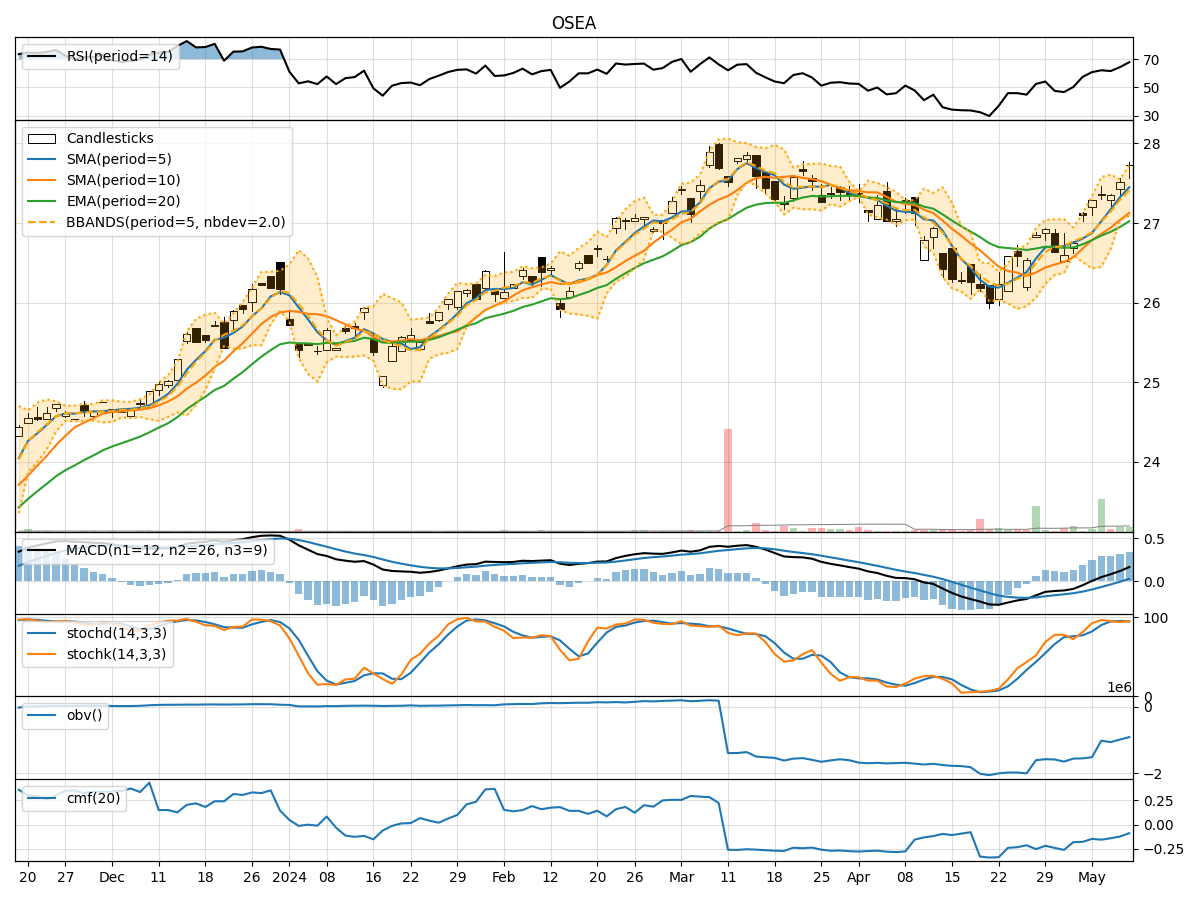
- Moving Averages (MA): The 5-day Moving Average has been consistently above the Simple Moving Average (SMA) and Exponential Moving Average (EMA), indicating a bullish trend.
- MACD: The MACD line has been consistently above the signal line, suggesting a positive momentum in the stock price.
- MACD Histogram: The MACD Histogram has been increasing over the last 5 days, indicating strengthening bullish momentum.
Momentum Indicators:
- RSI: The Relative Strength Index (RSI) has been gradually increasing and is currently in the overbought territory, suggesting a potential pullback.
- Stochastic Oscillator: Both %K and %D lines of the Stochastic Oscillator are in the overbought zone, indicating a possible reversal.
- Williams %R: The Williams %R is also in the overbought region, signaling a potential downward correction.
Volatility Indicators:
- Bollinger Bands: The stock price has been trading within the Bollinger Bands, with the bands widening slightly, indicating increased volatility.
- Bollinger %B: The %B indicator is above 0.8, suggesting the stock is trading near the upper band, potentially overbought.
Volume Indicators:
- On-Balance Volume (OBV): The OBV has been declining over the last 5 days, indicating selling pressure in the stock.
- Chaikin Money Flow (CMF): The CMF has been negative, reflecting a lack of buying interest in the stock.
Conclusion:
Based on the analysis of the technical indicators, the stock is currently exhibiting signs of being overbought and potentially due for a correction. The momentum indicators, such as RSI, Stochastic Oscillator, and Williams %R, all point towards a possible downward movement in the stock price. Additionally, the declining OBV and negative CMF suggest a lack of buying interest and selling pressure in the stock.
Recommendation:
Given the overbought conditions and bearish signals from the momentum indicators, it is advisable to exercise caution in entering new long positions at the current price levels. Traders may consider taking profits on existing positions or implementing risk management strategies to protect against a potential downside risk. Monitoring the price action closely for a potential reversal or consolidation phase would be prudent before considering new entry points.
Key Conclusion:
Bearish View: The technical indicators suggest a potential downward movement in the stock price in the coming days. Investors should be prepared for a possible correction or consolidation phase.