Technical Analysis of OVL 2024-05-10
Overview:
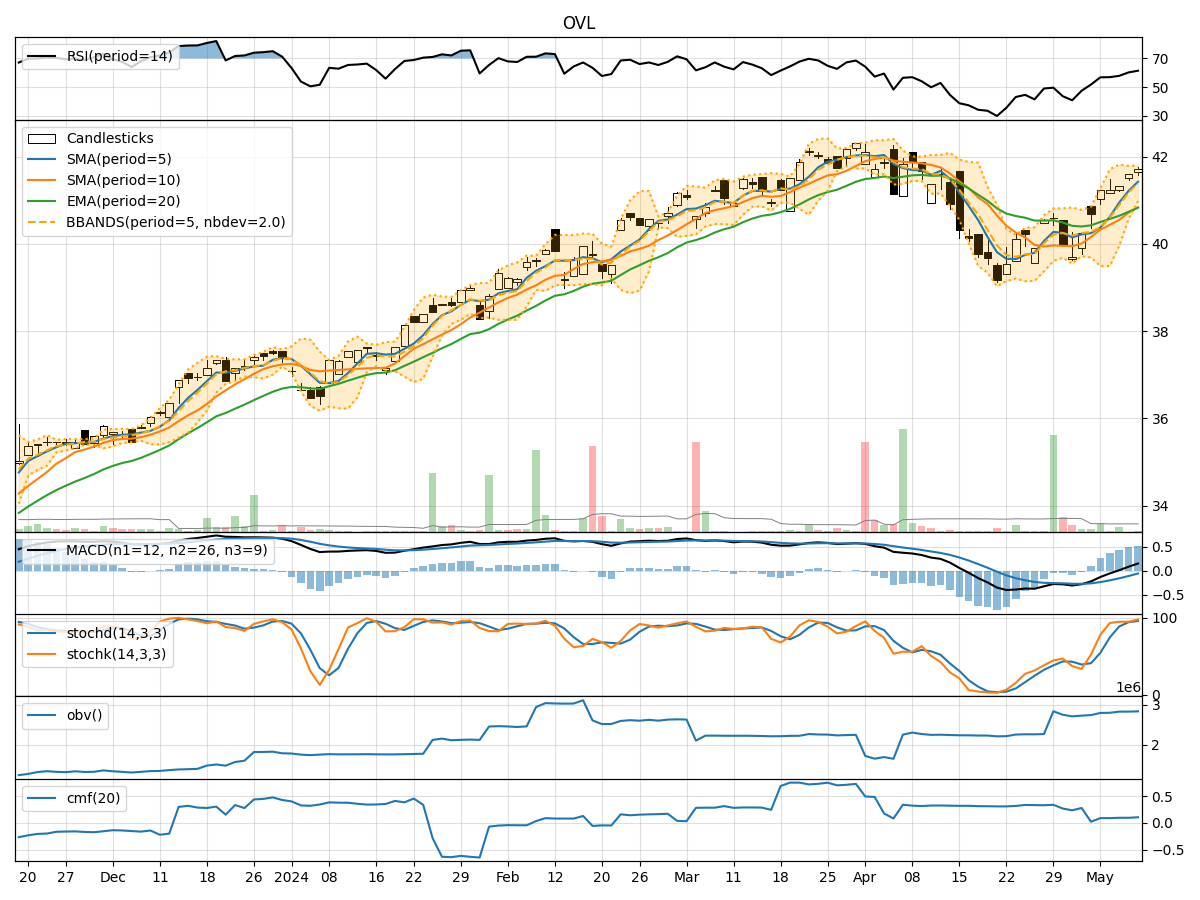
In analyzing the technical indicators for OVL stock over the last 5 days, we will delve into the trend, momentum, volatility, and volume indicators to provide a comprehensive outlook on the possible stock price movement in the coming days. By examining key metrics such as moving averages, MACD, RSI, Stochastic Oscillator, Bollinger Bands, OBV, and more, we aim to offer valuable insights and predictions for potential price action.
Trend Indicators:
- Moving Averages (MA): The 5-day MA has been consistently above the closing prices, indicating a bullish trend.
- MACD: The MACD line has been above the signal line, suggesting a positive momentum in the stock price.
- EMA: The EMA has been trending upwards, supporting the bullish sentiment.
Momentum Indicators:
- RSI: The RSI has been in the overbought territory, indicating a strong bullish momentum.
- Stochastic Oscillator: Both %K and %D have been in the overbought zone, signaling a potential reversal.
Volatility Indicators:
- Bollinger Bands: The stock price has been trading near the upper Bollinger Band, suggesting a high volatility period.
Volume Indicators:
- OBV: The On-Balance Volume has been increasing, indicating accumulation by investors.
- CMF: The Chaikin Money Flow has been positive, reflecting buying pressure in the stock.
Key Observations:
- The stock is currently in a strong uptrend based on moving averages and MACD.
- Momentum indicators like RSI and Stochastic Oscillator suggest overbought conditions, hinting at a possible correction.
- Volatility remains high as the stock price is near the upper Bollinger Band.
- Volume indicators show positive accumulation and buying pressure.
Conclusion:
Based on the technical indicators and analysis: - The stock is likely to experience a short-term correction or consolidation due to overbought conditions indicated by momentum indicators. - However, the overall trend remains bullish, supported by moving averages and MACD. - Investors should be cautious of potential profit-taking or a pullback in the stock price in the coming days.
Recommendation:
- Consider taking partial profits if holding a long position to lock in gains.
- Monitor the price action closely for signs of a reversal or continuation of the bullish trend.
- Wait for a clearer signal from momentum indicators before entering new positions.
By combining insights from various technical indicators, we can better navigate the market dynamics and make informed decisions in trading or investing in OVL stock.