Technical Analysis of OVS 2024-05-10
Overview:
In analyzing the technical indicators for OVS stock over the last 5 days, we will delve into the trend, momentum, volatility, and volume indicators to provide a comprehensive outlook on the possible future stock price movement. By examining these key indicators, we aim to offer valuable insights and recommendations for potential investors.
Trend Analysis:
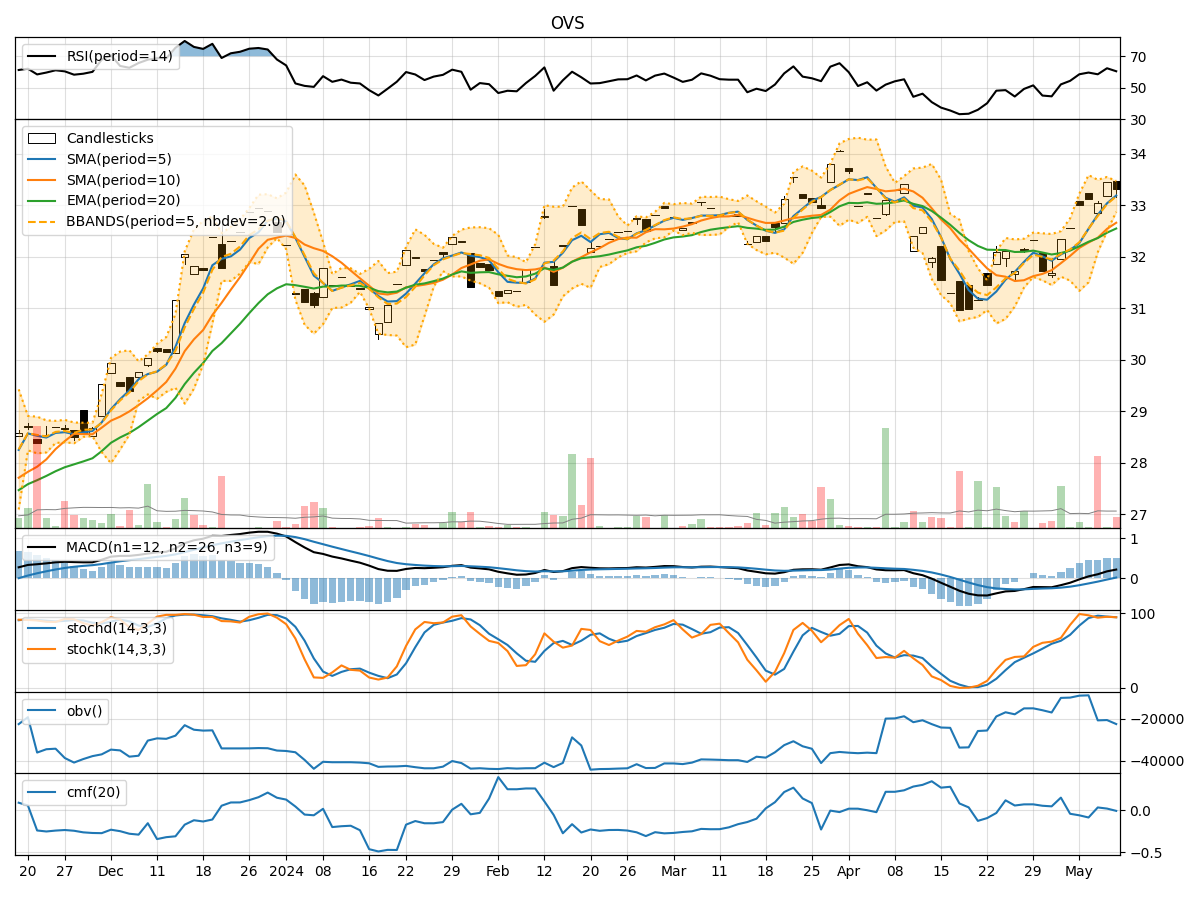
- Moving Averages (MA): The 5-day Moving Average (MA) has been consistently above the Simple Moving Average (SMA) and Exponential Moving Average (EMA), indicating a bullish trend.
- MACD: The MACD line has been consistently above the signal line, suggesting a bullish momentum in the stock price.
- MACD Histogram: The MACD Histogram has been increasing, indicating strengthening bullish momentum.
Momentum Analysis:
- RSI: The Relative Strength Index (RSI) has been fluctuating around the 60-65 range, indicating a neutral momentum.
- Stochastic Oscillator: Both %K and %D have been hovering around the overbought zone, suggesting a potential reversal or consolidation.
- Williams %R: The Williams %R is showing oversold conditions, indicating a possible buying opportunity.
Volatility Analysis:
- Bollinger Bands (BB): The stock price has been trading within the Bollinger Bands, with the bands narrowing, suggesting reduced volatility.
- Bollinger %B: The %B indicator is below 1, indicating the price is below the upper band, potentially signaling a reversal or consolidation.
Volume Analysis:
- On-Balance Volume (OBV): The OBV has been fluctuating, indicating indecision among investors.
- Chaikin Money Flow (CMF): The CMF has been negative, suggesting selling pressure in the stock.
Conclusion:
Based on the analysis of the technical indicators, the stock is currently in a bullish trend with strong momentum indicated by the MACD. However, the overbought conditions in the Stochastic Oscillator and the potential reversal signals in the Williams %R suggest a possible short-term correction or consolidation. The narrowing Bollinger Bands and negative CMF also support the view of a potential consolidation phase.
Therefore, the next few days may see the stock price experiencing sideways movement or a slight pullback before potentially resuming its upward trajectory. Investors should closely monitor the key support and resistance levels along with any significant changes in the technical indicators to make informed trading decisions.