Technical Analysis of PAB 2024-05-10
Overview:
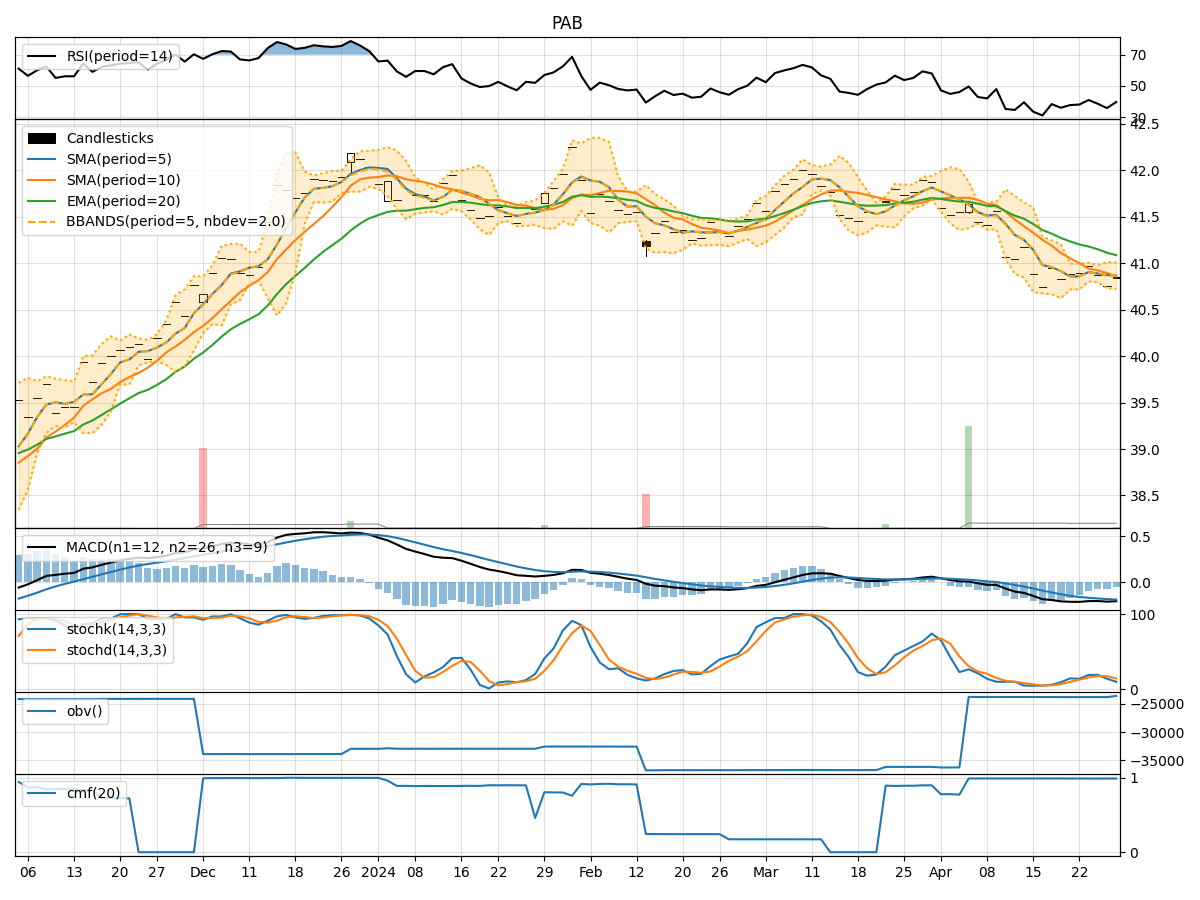
In analyzing the technical indicators for PAB stock over the last 5 days, we will delve into the trend, momentum, volatility, and volume indicators to provide a comprehensive outlook on the possible stock price movement in the coming days. By examining these key indicators, we aim to offer valuable insights and predictions for potential investors.
Trend Indicators:
- Moving Averages (MA): The 5-day Moving Average (MA) has been consistently above the Simple Moving Average (SMA) and Exponential Moving Average (EMA), indicating a short-term uptrend.
- MACD: The MACD line has been positive, showing bullish momentum, although the MACD Histogram has been decreasing slightly.
Momentum Indicators:
- RSI: The Relative Strength Index (RSI) has been fluctuating around the neutral level of 50, suggesting a lack of strong momentum in either direction.
- Stochastic Oscillator: Both %K and %D have been declining, indicating a potential shift towards oversold conditions.
Volatility Indicators:
- Bollinger Bands (BB): The stock price has been trading within the Bollinger Bands, with the bands narrowing, suggesting decreasing volatility.
Volume Indicators:
- On-Balance Volume (OBV): The OBV has been relatively stable, indicating a balance between buying and selling pressure.
- Chaikin Money Flow (CMF): The CMF has been positive, reflecting a net inflow of money into the stock over the past 20 days.
Key Observations:
- The trend indicators suggest a short-term uptrend in the stock price.
- Momentum indicators show mixed signals, with RSI hovering around the neutral level and stochastic indicators pointing towards potential oversold conditions.
- Volatility has been decreasing, indicating a possible period of consolidation.
- Volume indicators reflect a balanced buying and selling pressure with a slight positive money flow into the stock.
Conclusion:
Based on the analysis of the technical indicators, the stock price of PAB is likely to experience a period of consolidation in the coming days. The mixed signals from momentum indicators and decreasing volatility suggest a lack of clear direction in the short term. Investors should monitor the stock closely for any potential breakout or reversal signals before making trading decisions.