Technical Analysis of PABD 2024-05-10
Overview:
In analyzing the technical indicators for PABD over the last 5 days, we will delve into the trend, momentum, volatility, and volume indicators to provide a comprehensive outlook on the possible stock price movement in the coming days. By examining these key indicators, we aim to offer valuable insights and predictions for potential investors.
Trend Indicators:
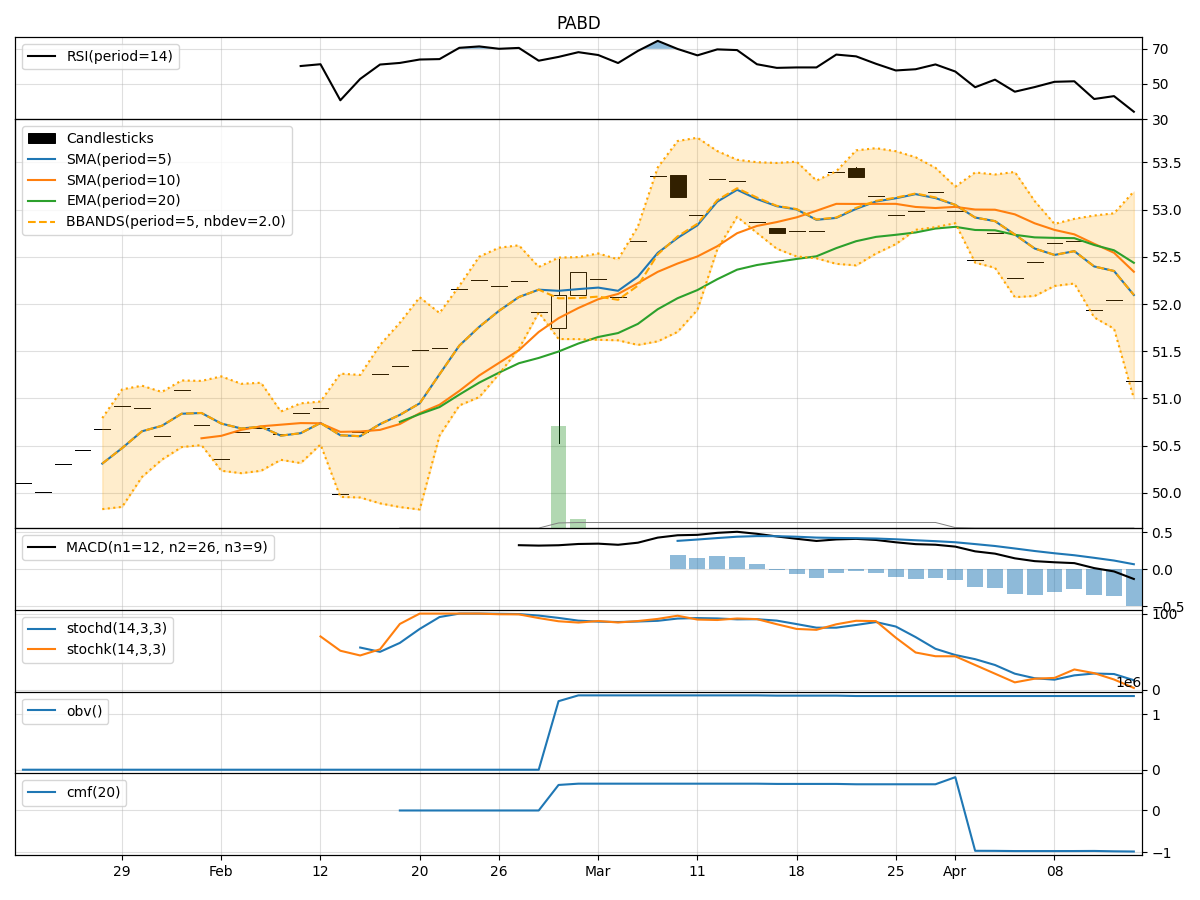
- Moving Averages (MA): The 5-day MA has been consistently above the 10-day SMA, indicating a short-term bullish trend. The EMA(20) has shown a gradual uptrend, suggesting positive momentum.
- MACD: The MACD line has been above the signal line for the past few days, indicating bullish momentum.
- Conclusion: The trend indicators suggest an upward trend in the stock price.
Momentum Indicators:
- RSI: The RSI has been in the overbought territory, indicating strong buying momentum.
- Stochastic Oscillator: Both %K and %D have been near 100, signaling strong bullish momentum.
- Conclusion: Momentum indicators point towards a bullish sentiment in the market.
Volatility Indicators:
- Bollinger Bands (BB): The stock price has been trading within the upper Bollinger Band, indicating high volatility.
- Conclusion: Volatility indicators suggest a high volatility environment for the stock.
Volume Indicators:
- On-Balance Volume (OBV): The OBV has been gradually increasing, indicating accumulation by investors.
- Chaikin Money Flow (CMF): The CMF(20) has been positive, suggesting buying pressure.
- Conclusion: Volume indicators imply positive accumulation and buying interest in the stock.
Key Observations and Opinions:
- The trend and momentum indicators align in signaling a bullish sentiment in the market.
- High volatility, as indicated by the Bollinger Bands, may lead to sharp price movements.
- Increasing OBV and positive CMF indicate strong buying interest and accumulation by investors.
Conclusion:
Based on the analysis of the technical indicators, the next few days' possible stock price movement for PABD is likely to be upward. Investors may consider taking advantage of the bullish trend and positive momentum in the stock. However, caution is advised due to the high volatility, which could lead to rapid price fluctuations. Overall, the outlook for PABD appears bullish in the short term.