Technical Analysis of PALC 2024-05-10
Overview:
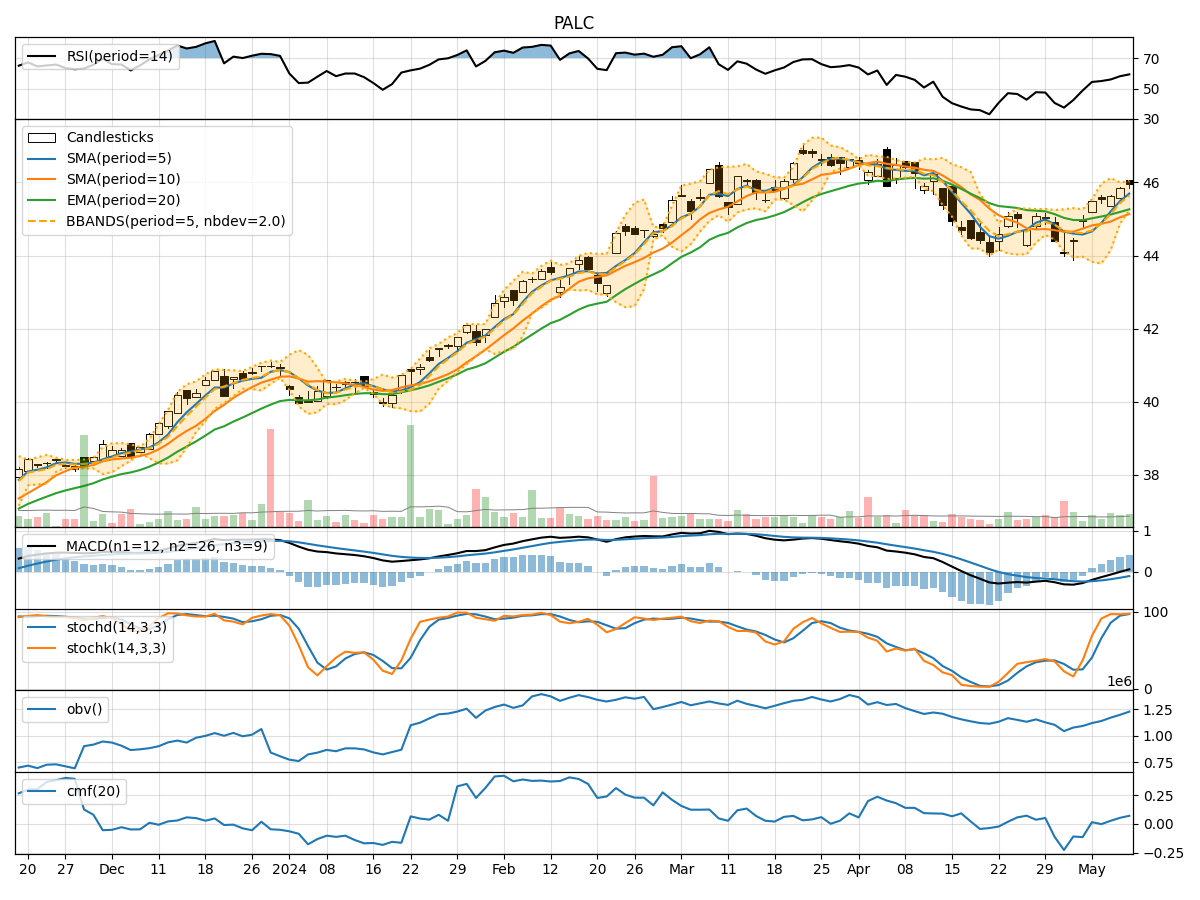
In analyzing the technical indicators for PALC over the last 5 days, we will delve into the trend, momentum, volatility, and volume indicators to provide a comprehensive outlook on the possible stock price movement in the coming days.
Trend Analysis:
- Moving Averages (MA): The 5-day Moving Average has been consistently above the Simple Moving Average (SMA) and Exponential Moving Average (EMA), indicating a bullish trend.
- MACD: The MACD line has been consistently above the signal line, suggesting a bullish momentum.
- RSI: The Relative Strength Index (RSI) has been trending upwards, indicating increasing buying pressure.
Momentum Analysis:
- Stochastic Oscillator: Both %K and %D have been in the overbought zone, suggesting a potential reversal or consolidation.
- Williams %R: The Williams %R is in the oversold territory, indicating a possible buying opportunity.
Volatility Analysis:
- Bollinger Bands: The stock price has been consistently trading above the middle Bollinger Band, indicating an uptrend.
- Bollinger %B: The %B indicator has been above 0.5, signifying bullish momentum.
Volume Analysis:
- On-Balance Volume (OBV): The OBV has been showing a slight decrease, indicating some distribution.
- Chaikin Money Flow (CMF): The CMF has been positive, suggesting buying pressure.
Key Observations:
- The trend indicators suggest a strong bullish sentiment in the short term.
- Momentum indicators show signs of potential overbought conditions, indicating a possible correction or consolidation.
- Volatility indicators point towards a continuation of the current uptrend.
- Volume indicators indicate a slight decrease in buying pressure but overall positive sentiment.
Conclusion:
Based on the analysis of the technical indicators, the next few days for PALC are likely to see continued upward movement in the stock price. However, caution is advised as momentum indicators signal potential overbought conditions, which could lead to a short-term correction or consolidation. Traders should closely monitor key support and resistance levels to capitalize on potential buying opportunities or manage risks effectively. Overall, the outlook remains bullish with a possibility of short-term pullbacks.