Technical Analysis of PAMC 2024-05-10
Overview:
In analyzing the technical indicators for PAMC stock over the last 5 days, we will delve into the trend, momentum, volatility, and volume indicators to provide a comprehensive outlook on the possible stock price movement in the coming days. By examining these key indicators, we aim to offer valuable insights and predictions for informed decision-making.
Trend Analysis:
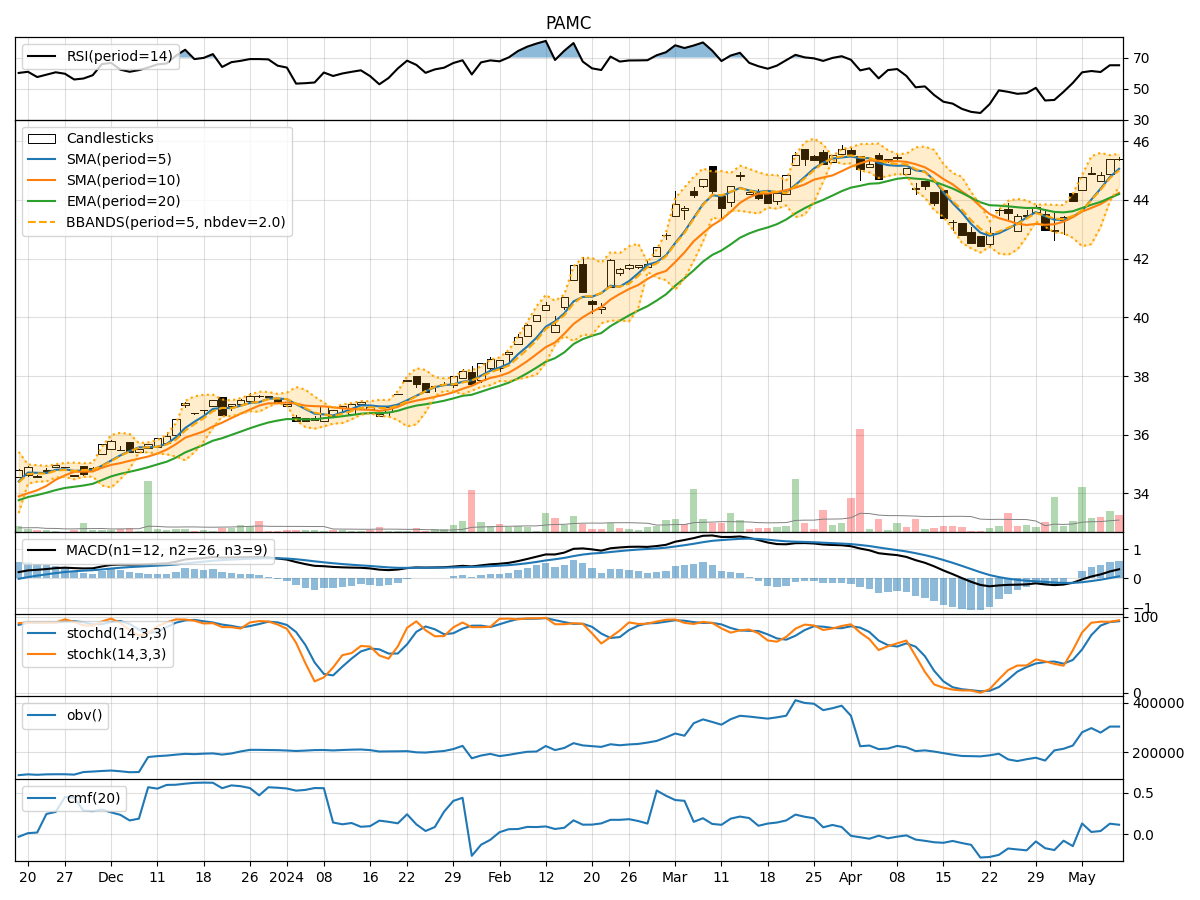
- Moving Averages (MA): The 5-day MA has been consistently above the 10-day SMA, indicating a short-term bullish trend.
- Exponential Moving Average (EMA): The EMA has been trending upwards, reflecting positive price momentum.
- Moving Average Convergence Divergence (MACD): The MACD line has been above the signal line, suggesting bullish momentum.
- Conclusion: The trend indicators point towards an upward trend in the stock price.
Momentum Analysis:
- Relative Strength Index (RSI): RSI values have been in the overbought territory, indicating strong buying momentum.
- Stochastic Oscillator: Both %K and %D have been in the overbought zone, signaling potential price strength.
- Williams %R (Willams %R): The indicator has been hovering near oversold levels, suggesting a possible reversal.
- Conclusion: Momentum indicators suggest a bullish sentiment in the market.
Volatility Analysis:
- Bollinger Bands (BB): The stock price has been trading within the upper Bollinger Band, indicating increased volatility.
- Conclusion: Volatility indicators imply a volatile trading environment for the stock.
Volume Analysis:
- On-Balance Volume (OBV): The OBV has shown mixed signals, with volume not confirming the price movement.
- Chaikin Money Flow (CMF): The CMF has been positive, indicating buying pressure in the market.
- Conclusion: Volume indicators present a neutral stance, lacking clear confirmation of the price trend.
Overall Conclusion:
Based on the analysis of trend, momentum, volatility, and volume indicators, the overall outlook for PAMC stock suggests a bullish sentiment in the short term. The trend indicators support an upward trajectory, while momentum indicators indicate strong buying momentum. However, the volatility in the market and the mixed signals from volume indicators warrant caution.
Forecast:
Given the current technical analysis and market dynamics, the next few days for PAMC stock are likely to see further upward movement with potential price appreciation. Traders and investors should closely monitor the price action, especially considering the volatility and volume dynamics, to capitalize on potential opportunities and manage risks effectively.