Technical Analysis of PAPR 2024-05-10
Overview:
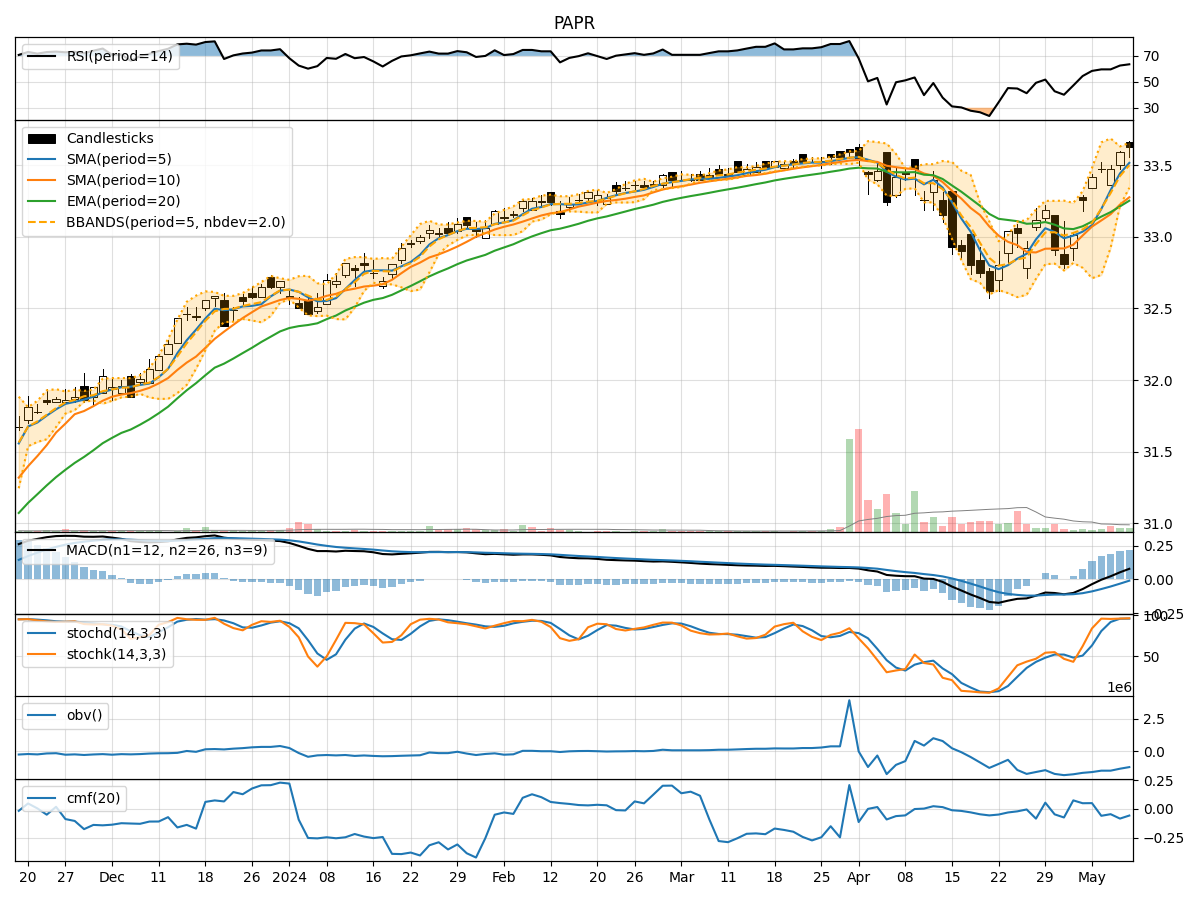
In analyzing the technical indicators for PAPR stock over the last 5 days, we will delve into the trend, momentum, volatility, and volume indicators to provide a comprehensive outlook on the possible stock price movement in the coming days. By examining these key indicators, we aim to offer valuable insights and predictions for informed decision-making.
Trend Analysis:
- Moving Averages (MA): The 5-day Moving Average (MA) has been consistently above the Simple Moving Average (SMA) and Exponential Moving Average (EMA), indicating a bullish trend.
- MACD: The MACD line has been consistently above the signal line, with both lines showing an upward trend, suggesting bullish momentum.
- RSI: The Relative Strength Index (RSI) has been trending upwards, indicating increasing buying pressure.
Momentum Analysis:
- Stochastic Oscillator: Both %K and %D lines of the Stochastic Oscillator are in the overbought zone, suggesting a potential reversal or consolidation.
- Williams %R: The Williams %R indicator is in the oversold zone, indicating a potential buying opportunity.
Volatility Analysis:
- Bollinger Bands (BB): The stock price has been trading within the Bollinger Bands, with the bands narrowing, suggesting a period of consolidation.
- BB% (Bollinger Band %B): The %B indicator is hovering around 0.8, indicating a relatively high position within the bands.
Volume Analysis:
- On-Balance Volume (OBV): The OBV indicator has been declining, suggesting a divergence between price and volume, which could signal a potential trend reversal.
- Chaikin Money Flow (CMF): The CMF has been negative, indicating selling pressure in the stock.
Conclusion:
Based on the analysis of the technical indicators, the next few days' possible stock price movement for PAPR appears to be sideways consolidation with a slight bullish bias. The bullish trend indicated by moving averages and MACD, coupled with the increasing RSI, suggests potential upward momentum. However, the overbought Stochastic Oscillator and declining OBV signal caution. Traders should monitor the stock closely for a potential breakout or reversal.