Technical Analysis of PAUG 2024-05-10
Overview:
In analyzing the technical indicators for PAUG stock over the last 5 days, we will delve into the trend, momentum, volatility, and volume indicators to provide a comprehensive outlook on the possible future stock price movement. By examining these key indicators, we aim to offer valuable insights and predictions for the upcoming trading days.
Trend Analysis:
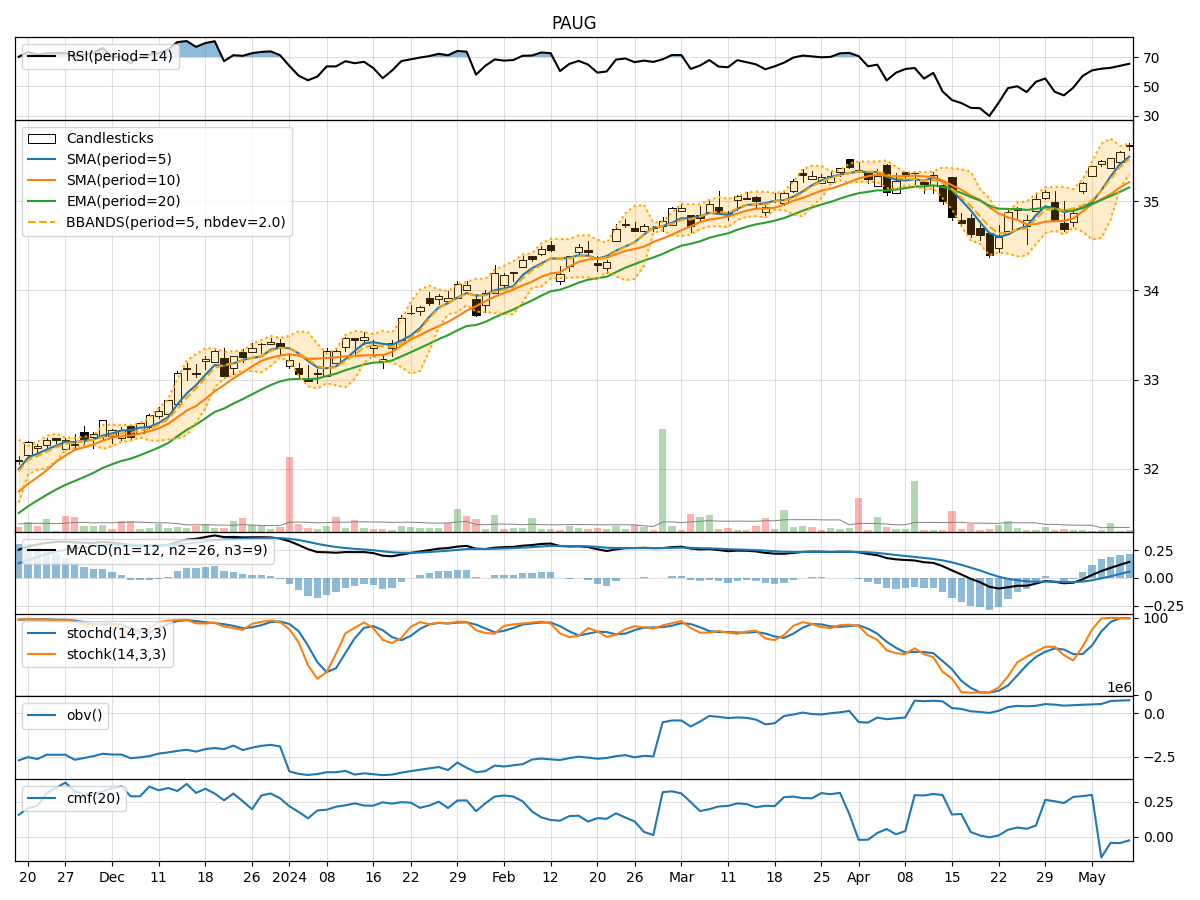
- Moving Averages (MA): The 5-day Moving Average (MA) has been consistently trending upwards, indicating a positive momentum in the stock price.
- MACD: The MACD line has been above the signal line for the past 5 days, suggesting a bullish trend in the stock.
- EMA: The Exponential Moving Average (EMA) has also been on an upward trajectory, supporting the bullish sentiment in the stock.
Momentum Analysis:
- RSI: The Relative Strength Index (RSI) has been steadily increasing, reaching overbought levels, which could signal a potential reversal or consolidation in the stock price.
- Stochastic Oscillator: Both %K and %D have been in the overbought zone, indicating a strong bullish momentum.
- Williams %R: The Williams %R is in the oversold territory, suggesting a possible reversal in the stock price.
Volatility Analysis:
- Bollinger Bands: The Bollinger Bands have been narrowing, indicating decreasing volatility in the stock price.
- Bollinger %B: The %B indicator is hovering around 0.8, suggesting that the stock is trading near the upper band, potentially indicating an overbought condition.
Volume Analysis:
- On-Balance Volume (OBV): The OBV has shown a slight increase over the past 5 days, indicating accumulation of the stock by investors.
- Chaikin Money Flow (CMF): The CMF has been negative, suggesting some selling pressure in the stock.
Key Observations:
- The stock is currently in a strong bullish trend based on the moving averages and MACD.
- Momentum indicators like RSI and Stochastic Oscillator suggest a potential overbought condition, indicating a need for caution.
- Volatility has been decreasing, which could lead to a period of consolidation or a potential reversal.
- Volume indicators show a slight increase in buying pressure but with some selling pressure as indicated by CMF.
Conclusion:
Based on the analysis of the technical indicators, the next few days for PAUG stock could see a potential consolidation or a slight pullback in the stock price. While the trend remains bullish, the overbought signals from momentum indicators and the narrowing Bollinger Bands suggest a possible period of sideways movement or a minor correction. Traders and investors should closely monitor key support and resistance levels to make informed decisions in the coming days.