Technical Analysis of PBJ 2024-05-10
Overview:
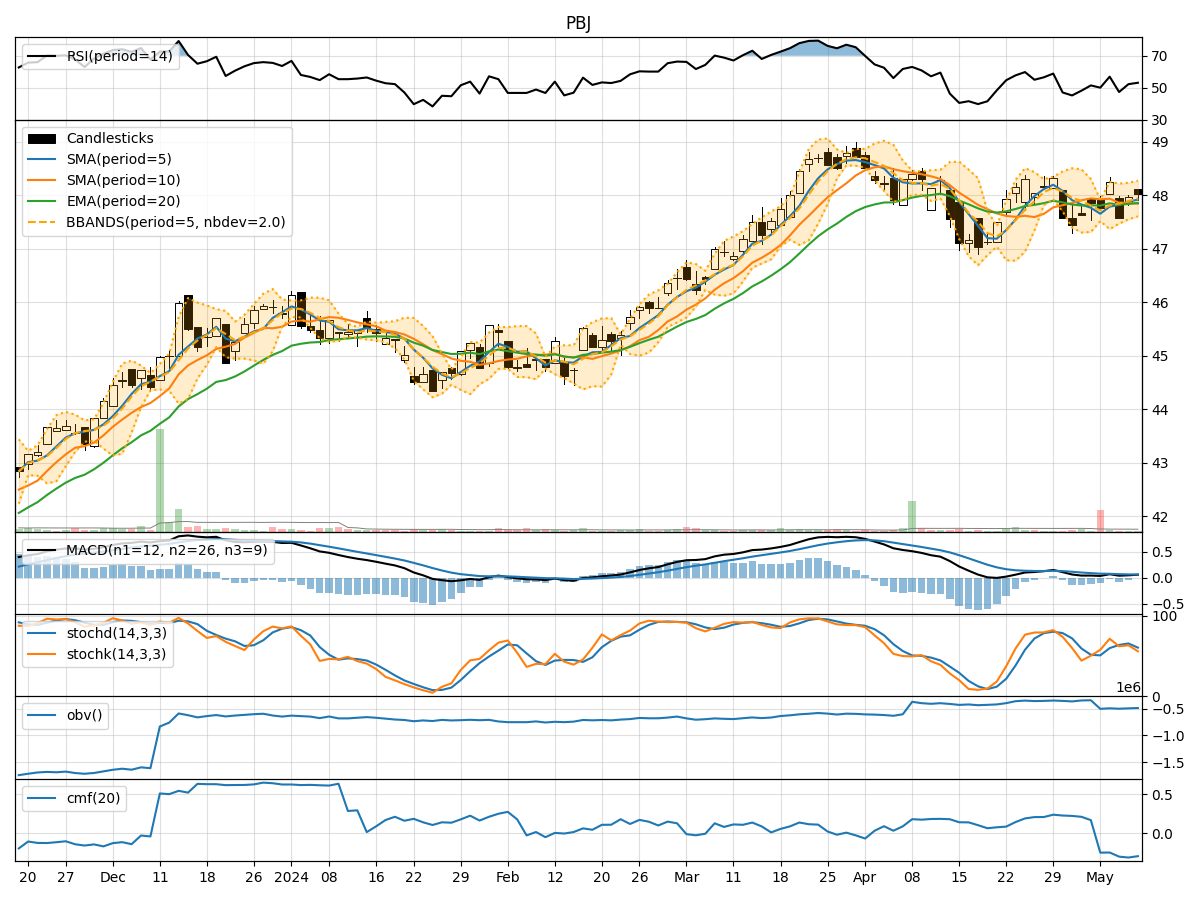
In analyzing the technical indicators for PBJ stock over the last 5 days, we will delve into the trend, momentum, volatility, and volume indicators to provide a comprehensive outlook on the possible stock price movement in the coming days. By examining these key aspects, we aim to offer valuable insights and predictions for informed decision-making.
Trend Analysis:
- Moving Averages (MA): The 5-day Moving Average (MA) has been fluctuating around the closing prices, indicating short-term price trends. The Simple Moving Average (SMA) and Exponential Moving Average (EMA) show a slight convergence, suggesting a potential trend reversal.
- MACD: The Moving Average Convergence Divergence (MACD) and its signal line have been close to each other, indicating a possible trend change. The MACD Histogram has been decreasing, signaling a weakening bullish momentum.
Momentum Analysis:
- RSI: The Relative Strength Index (RSI) has been oscillating around the neutral zone, indicating a lack of strong momentum in either direction.
- Stochastic Oscillator: Both %K and %D lines of the Stochastic Oscillator have shown mixed signals, with %K hovering around 50. This suggests a potential consolidation phase.
- Williams %R: The Williams %R indicator has been fluctuating in the oversold region, indicating a possible reversal in the short term.
Volatility Analysis:
- Bollinger Bands: The Bollinger Bands have shown narrowing width, suggesting decreasing volatility. The price has been trading within the bands, indicating a period of consolidation.
- Bollinger %B: The %B indicator has been fluctuating around 0.5, reflecting a balanced market sentiment with no clear trend bias.
Volume Analysis:
- On-Balance Volume (OBV): The OBV indicator has shown mixed signals, with no clear accumulation or distribution pattern.
- Chaikin Money Flow (CMF): The CMF has been negative, indicating a lack of buying pressure and potential selling interest in the stock.
Conclusion:
Based on the analysis of the technical indicators, the stock price of PBJ is likely to experience sideways movement in the next few days. The trend indicators suggest a potential trend reversal, while the momentum indicators point towards a lack of strong directional momentum. Volatility is decreasing, indicating a period of consolidation, and volume indicators show mixed signals with no clear accumulation or distribution pattern.
In conclusion, the overall outlook for PBJ stock is neutral with a bias towards sideways movement. Traders and investors should closely monitor key support and resistance levels for potential breakout opportunities.