Technical Analysis of PBJA 2024-05-10
Overview:
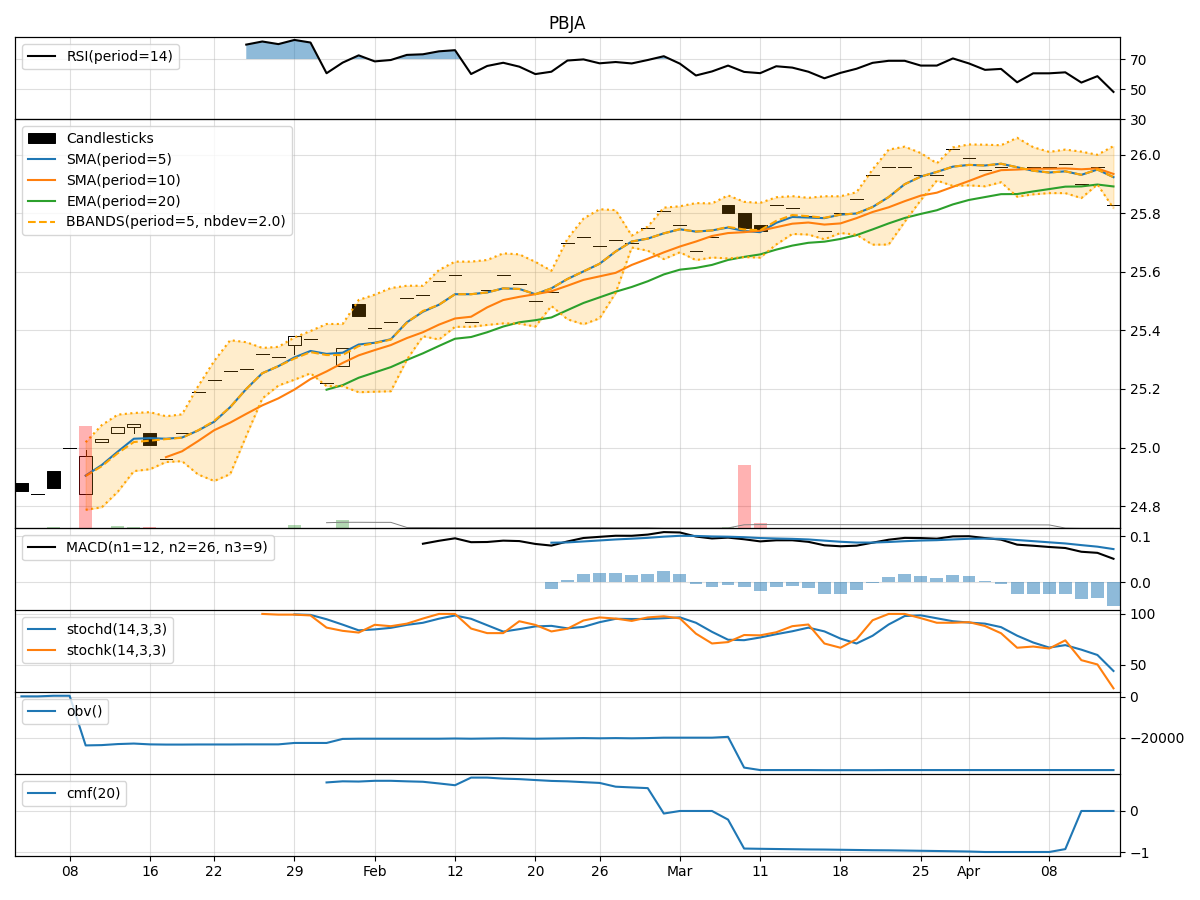
In analyzing the technical indicators for PBJA over the last 5 days, we will delve into the trends, momentum, volatility, and volume aspects to provide a comprehensive outlook on the possible stock price movement. By examining key indicators such as moving averages, MACD, RSI, Bollinger Bands, and OBV, we aim to offer valuable insights and predictions for the upcoming days.
Trend Analysis:
- Moving Averages (MA): The 5-day moving average has been consistently above the simple moving average (SMA) and exponential moving average (EMA), indicating a bullish trend.
- MACD: The MACD line has been consistently above the signal line, with both lines showing an upward trend, suggesting bullish momentum.
Momentum Analysis:
- RSI: The Relative Strength Index (RSI) has been gradually increasing and is currently in the overbought territory, indicating strong buying momentum.
- Stochastic Oscillator: Both %K and %D lines of the Stochastic Oscillator are at 100%, signaling a strong bullish momentum.
Volatility Analysis:
- Bollinger Bands (BB): The stock price has been trading within the upper Bollinger Band (BBU), indicating high volatility and potential overbought conditions.
Volume Analysis:
- On-Balance Volume (OBV): The OBV has been relatively stable, showing a slight decrease, which may suggest some distribution happening in the stock.
Key Observations:
- The stock is currently in a strong bullish trend based on moving averages and MACD.
- Momentum indicators like RSI and Stochastic Oscillator suggest strong buying momentum.
- Volatility is high as the stock price is near the upper Bollinger Band.
- Volume has shown a slight decrease, indicating some selling pressure.
Conclusion:
Based on the technical analysis of the indicators, the stock is likely to experience a short-term pullback or consolidation in the upcoming days. The overbought conditions indicated by RSI and Stochastic Oscillator, coupled with high volatility near the upper Bollinger Band, suggest a potential reversal or sideways movement. Traders may consider taking profits or waiting for a better entry point before considering long positions. It is essential to monitor the price action closely for any signs of a trend reversal or continuation.