Technical Analysis of PBMR 2024-05-10
Overview:
In analyzing the technical indicators for PBMR stock over the last 5 days, we will delve into the trends, momentum, volatility, and volume indicators to provide a comprehensive outlook on the possible stock price movement in the coming days. By examining key metrics such as moving averages, MACD, RSI, Bollinger Bands, and OBV, we aim to offer valuable insights and recommendations for potential investors.
Trend Indicators:
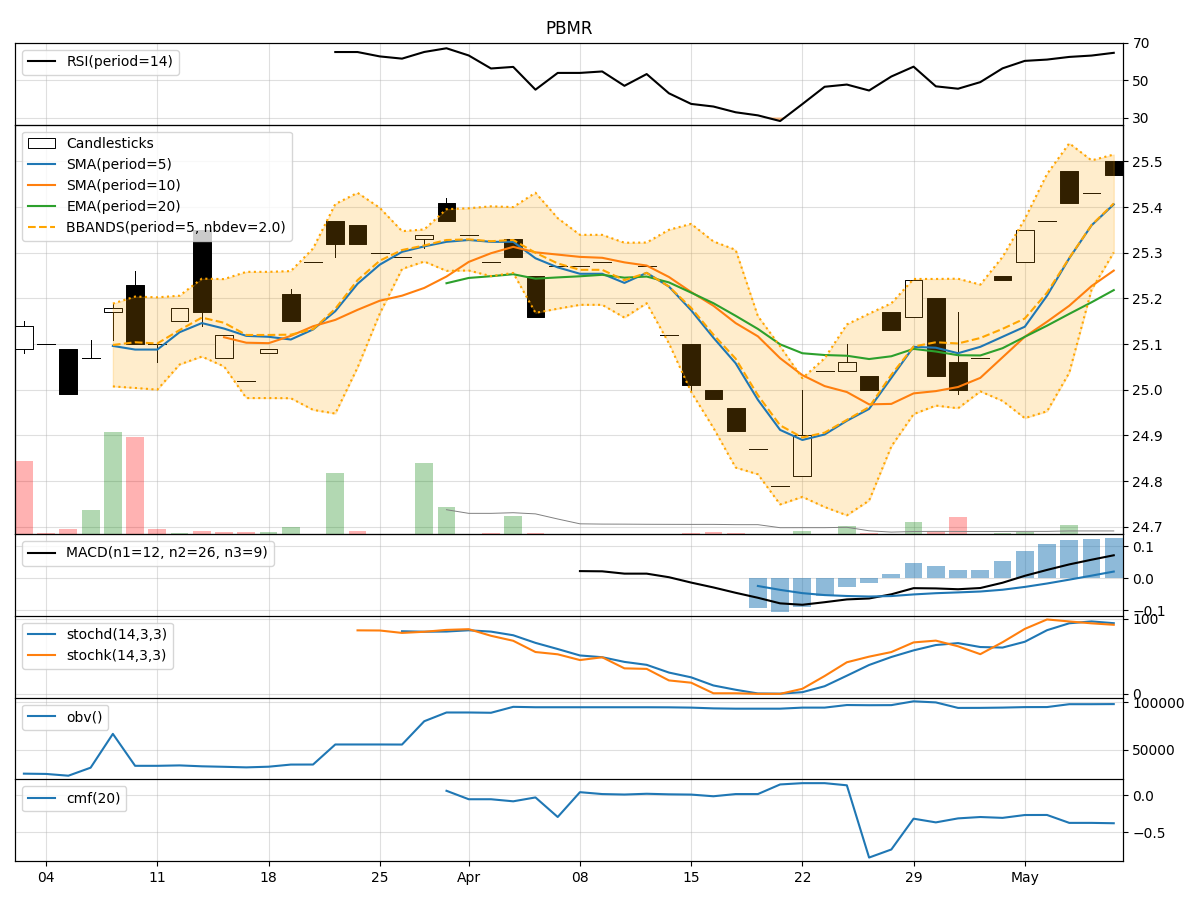
- Moving Averages (MA): The 5-day MA has been consistently above the closing price, indicating a bullish trend.
- MACD: The MACD line has been steadily increasing, with the MACD histogram showing positive values, suggesting a bullish momentum.
- EMA: The EMA has been trending upwards, supporting the bullish sentiment in the short term.
Momentum Indicators:
- RSI: The RSI has been gradually increasing and is currently in the overbought territory, signaling a strong bullish momentum.
- Stochastic Oscillator: Both %K and %D lines of the Stochastic Oscillator have been high, indicating an overbought condition.
- Williams %R: The Williams %R is also in the overbought region, further confirming the strong bullish momentum.
Volatility Indicators:
- Bollinger Bands (BB): The stock price has been trading close to the upper Bollinger Band, suggesting high volatility and a potential overbought condition.
- Bollinger Band Width (BBW): The BBW has been relatively narrow, indicating a period of consolidation or low volatility.
- Bollinger Band %B (BBP): The %B is above 0.8, indicating that the stock is trading at the upper end of its recent price range.
Volume Indicators:
- On-Balance Volume (OBV): The OBV has been relatively flat, suggesting a lack of strong buying or selling pressure.
- Chaikin Money Flow (CMF): The CMF has been negative, indicating a bearish money flow trend over the past 20 days.
Conclusion:
Based on the analysis of the technical indicators, the stock is currently exhibiting strong bullish momentum, as indicated by the increasing moving averages, positive MACD, and overbought conditions in RSI, Stochastic Oscillator, and Williams %R. However, the high volatility near the upper Bollinger Band and negative CMF signal caution.
Overall Assessment:
- Bullish Momentum: The stock is likely to continue its upward trend in the short term.
- Caution on Overbought Conditions: Watch for potential pullbacks or corrections due to the overbought signals in various momentum indicators.
- Volatility Concerns: High volatility near the upper Bollinger Band suggests a potential reversal or consolidation phase.
- Volume Weakness: The lack of significant volume movements may limit the sustainability of the bullish trend.
Recommendation:
- Short-Term: Consider taking profits if the stock price continues to rise significantly.
- Medium- to Long-Term: Monitor for signs of a potential reversal or consolidation before considering new entry points.
Key Words:
- Upward Momentum
- Overbought Conditions
- Caution on Volatility
- Monitor Volume Strength
Final Verdict:
Given the current technical indicators, the stock is likely to experience further upward movement in the short term, but investors should remain cautious of potential reversals or corrections due to overbought conditions and high volatility.