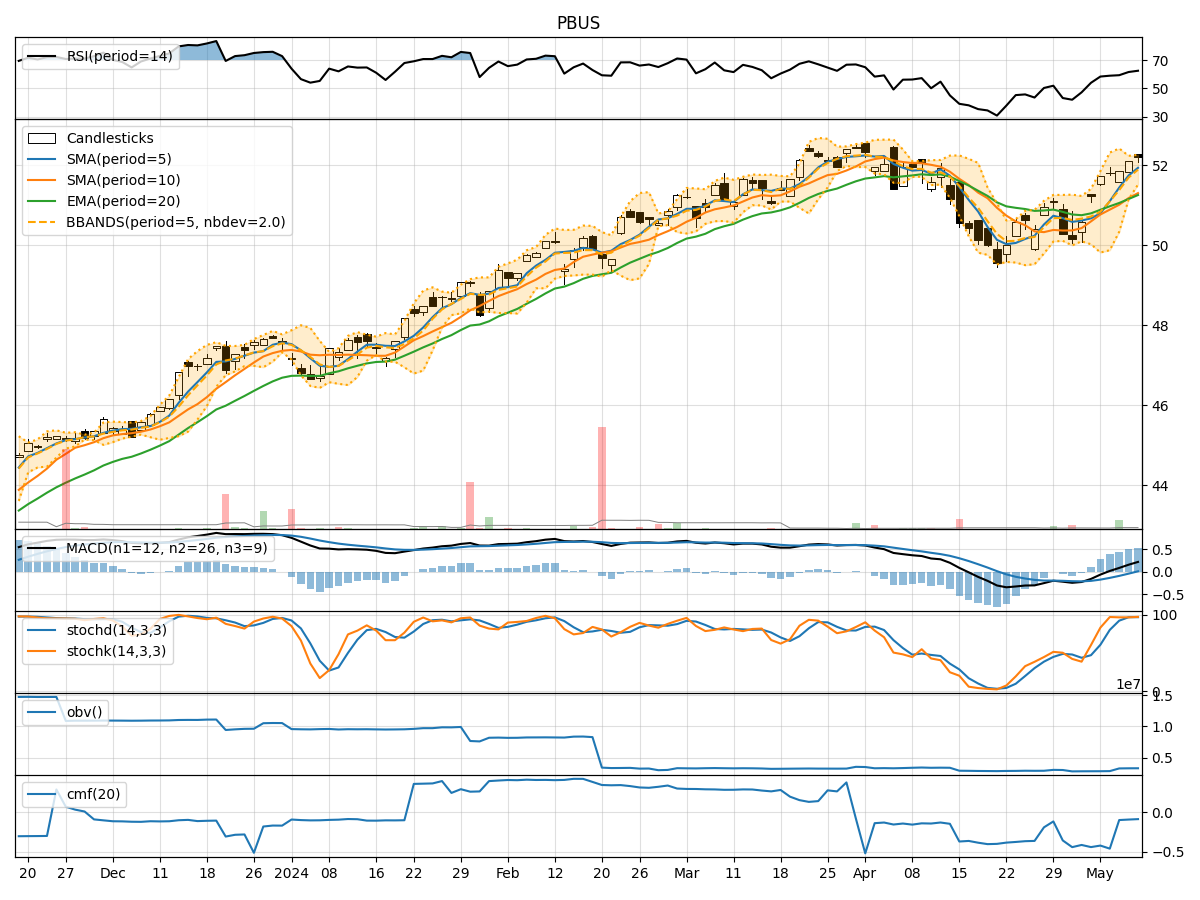
Technical Analysis of PBUS 2024-05-10
Overview:
In analyzing the technical indicators for PBUS stock over the last 5 days, we will delve into the trend, momentum, volatility, and volume indicators to provide a comprehensive outlook on the possible future stock price movement. By examining these key indicators, we aim to offer valuable insights and predictions for the upcoming trading days.
Trend Analysis:
- Moving Averages (MA): The 5-day Moving Average (MA) has been consistently trending upwards, indicating a positive momentum in the stock price.
- MACD: The Moving Average Convergence Divergence (MACD) has shown an increasing trend, with the MACD line crossing above the signal line, suggesting a bullish signal.
- EMA: The Exponential Moving Average (EMA) has been on an upward trajectory, further supporting the bullish sentiment in the short to medium term.
Momentum Analysis:
- RSI: The Relative Strength Index (RSI) has been gradually increasing, reaching levels above 60, indicating a strengthening momentum in the stock.
- Stochastic Oscillator: Both %K and %D lines of the Stochastic Oscillator have been consistently high, signaling an overbought condition but also reflecting strong buying pressure.
- Williams %R: The Williams %R indicator has been hovering around oversold levels, suggesting a potential reversal in the stock price.
Volatility Analysis:
- Bollinger Bands: The Bollinger Bands have been narrowing, indicating decreasing volatility in the stock price. This could potentially lead to a breakout or a significant price movement in the near future.
- Bollinger %B: The %B indicator has been gradually increasing, suggesting a potential bullish momentum building up.
Volume Analysis:
- On-Balance Volume (OBV): The OBV indicator has shown a slight decrease, indicating some distribution happening in the stock.
- Chaikin Money Flow (CMF): The CMF has been negative, reflecting a lack of buying pressure and potential weakness in the stock.
Conclusion:
Based on the analysis of the technical indicators, the overall outlook for PBUS stock in the next few days is bullish. The trend indicators, momentum indicators, and volatility indicators all point towards a potential upward movement in the stock price. However, the volume indicators show some signs of distribution, which could lead to short-term fluctuations.
Key Conclusion: The stock is likely to experience an upward movement in the next few days, with potential for a breakout based on the narrowing Bollinger Bands and bullish momentum indicators. Traders may consider entering long positions with appropriate risk management strategies in place.