Technical Analysis of PCCE 2024-05-10
Overview:
In analyzing the technical indicators for PCCE over the last 5 days, we will delve into the trend, momentum, volatility, and volume indicators to provide a comprehensive outlook on the possible stock price movement in the coming days. By examining key metrics such as moving averages, MACD, RSI, Bollinger Bands, and OBV, we aim to offer valuable insights and recommendations for potential trading strategies.
Trend Indicators:
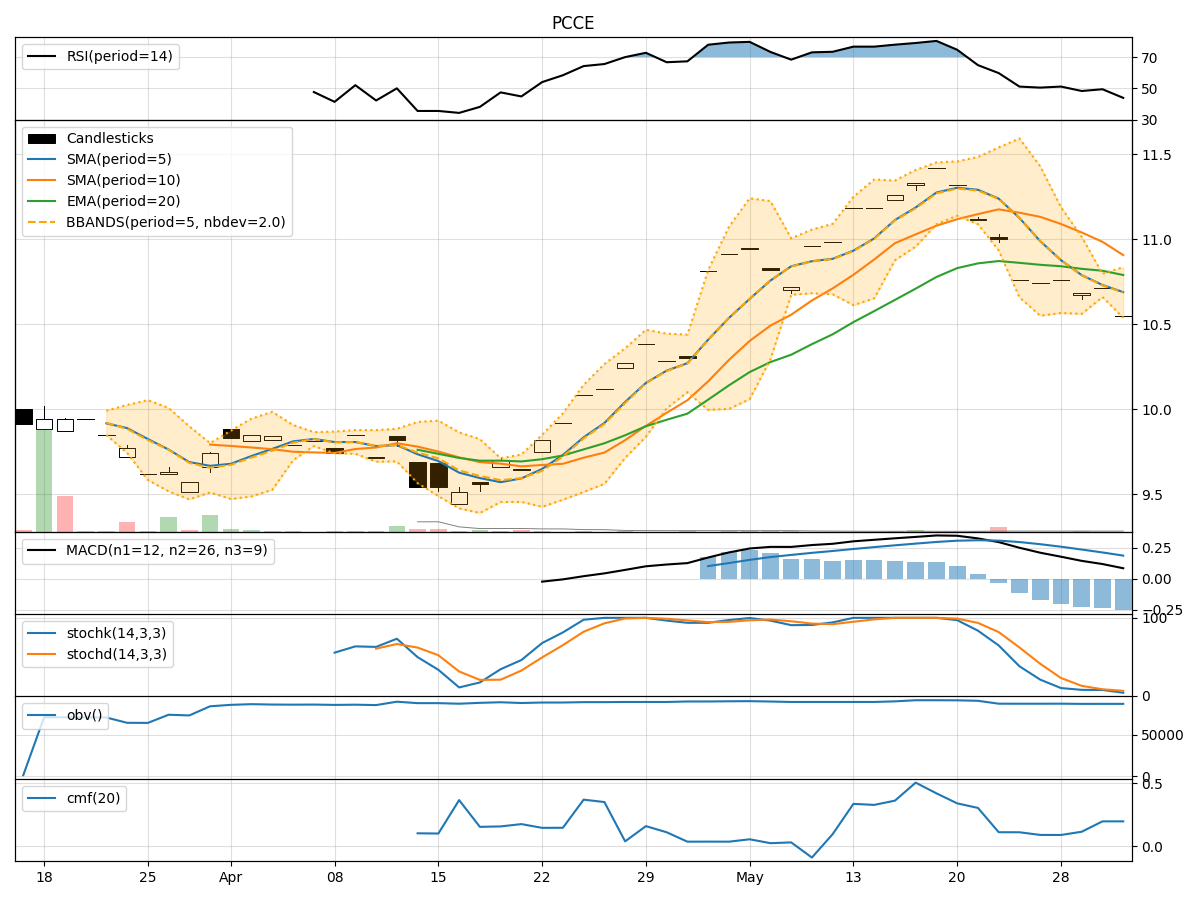
- Moving Averages (MA): The 5-day moving average has been consistently above the 10-day simple moving average, indicating a short-term bullish trend.
- MACD: The MACD line has been above the signal line, with both lines showing an upward trend, suggesting bullish momentum.
- EMA: The exponential moving average has been steadily increasing, supporting the bullish sentiment in the short to medium term.
Momentum Indicators:
- RSI: The Relative Strength Index has been fluctuating but generally staying within the overbought territory, indicating strong buying pressure.
- Stochastic Oscillator: Both %K and %D have been relatively high, suggesting that the stock is in overbought territory.
- Williams %R: The Williams %R has been hovering around oversold levels, indicating a potential reversal in the short term.
Volatility Indicators:
- Bollinger Bands: The stock price has been trading within the upper Bollinger Band, indicating an overbought condition.
- Bollinger Band Width: The narrowing of the Bollinger Band width suggests decreasing volatility and a possible period of consolidation.
- Bollinger Band %B: The %B indicator has been above 0.5, indicating an uptrend but approaching potential overbought levels.
Volume Indicators:
- On-Balance Volume (OBV): The OBV has been relatively flat, suggesting a balance between buying and selling pressure.
- Chaikin Money Flow (CMF): The CMF has been positive, indicating that money is flowing into the stock, supporting the bullish sentiment.
Conclusion:
Based on the analysis of the technical indicators, the stock of PCCE is currently exhibiting strong bullish momentum, supported by the uptrend in moving averages, MACD, and RSI. However, the stock is also showing signs of being overbought, as indicated by the Stochastic Oscillator and Bollinger Bands. The narrowing Bollinger Band width suggests a potential period of consolidation or a minor pullback in the near term.
Key Conclusion:
Given the current technical indicators, the stock of PCCE is likely to experience a short-term consolidation or minor pullback before potentially resuming its upward trajectory. Traders should exercise caution and consider taking profits or implementing risk management strategies in anticipation of a temporary price correction.