Technical Analysis of PCEF 2024-05-10
Overview:
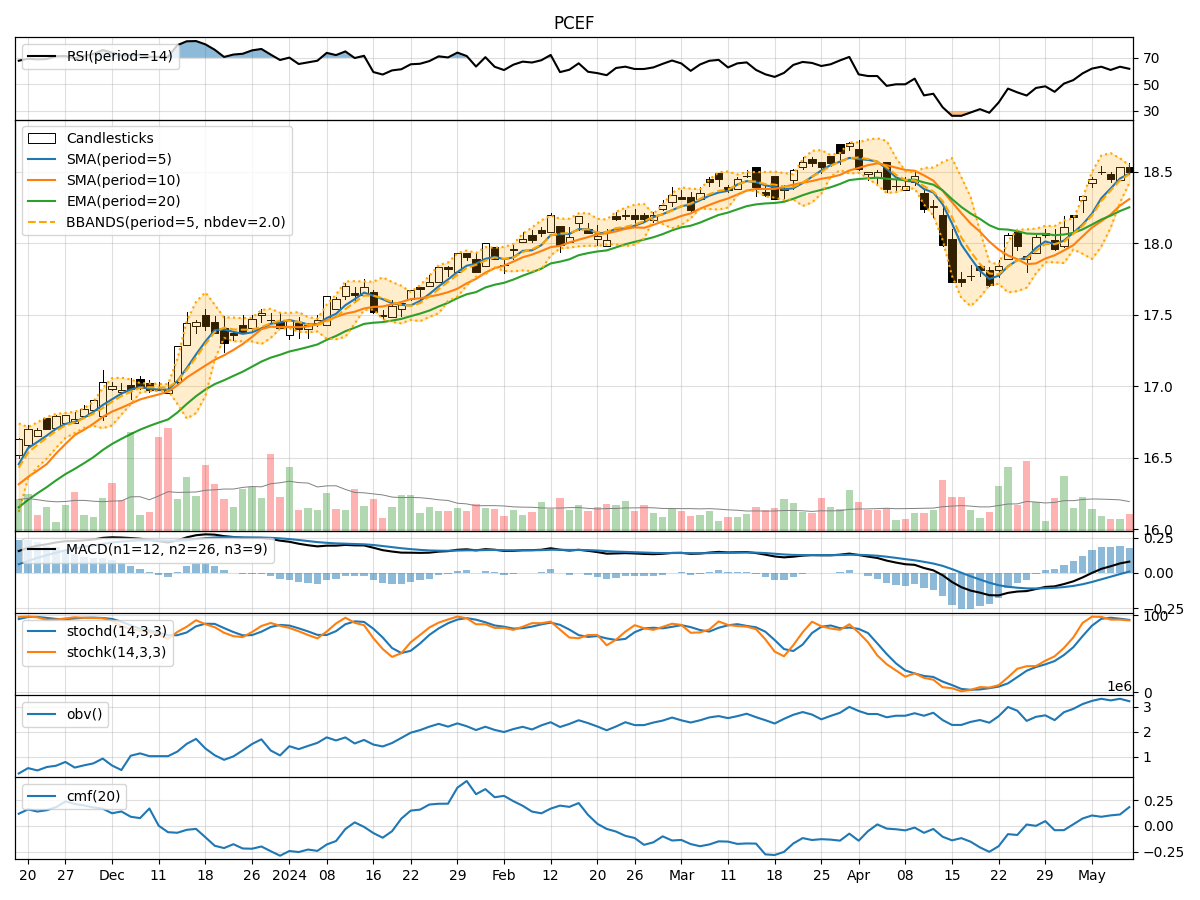
In the last 5 trading days, PCEF has shown a relatively stable price movement with minor fluctuations. The trend indicators suggest a slightly bullish sentiment, supported by moving averages and MACD values. Momentum indicators indicate a neutral to slightly bullish momentum, with RSI values hovering around the mid-range. Volatility indicators show a decreasing trend in volatility, while volume indicators suggest a positive accumulation distribution.
Trend Indicators Analysis:
- Moving Averages (MA): The 5-day MA has been consistently above the 10-day SMA, indicating a short-term bullish trend. The EMA(20) is also showing an upward trajectory, supporting a bullish sentiment.
- MACD: The MACD line has been consistently above the signal line, with both lines showing an upward trend. The MACD histogram has been positive, indicating bullish momentum.
Momentum Indicators Analysis:
- RSI: The RSI values have been fluctuating around the neutral level of 50, suggesting a balanced momentum without extreme overbought or oversold conditions.
- Stochastic Oscillator: Both %K and %D values of the stochastic oscillator have been above 80, indicating a strong bullish momentum. However, %D has shown some signs of potential reversal.
Volatility Indicators Analysis:
- Bollinger Bands (BB): The Bollinger Bands have been narrowing, indicating decreasing volatility in the stock price. The bands are relatively close to each other, suggesting a period of consolidation.
- Bollinger %B: The %B value has been hovering around 0.5, indicating the price is at the middle of the bands, further supporting the consolidation phase.
Volume Indicators Analysis:
- On-Balance Volume (OBV): The OBV values have shown a slight increase over the last 5 days, indicating positive volume accumulation despite some fluctuations.
- Chaikin Money Flow (CMF): The CMF(20) values have been consistently positive, indicating buying pressure in the stock.
Key Observations:
- The trend indicators suggest a bullish sentiment in the short term.
- Momentum indicators show a neutral to slightly bullish momentum.
- Volatility indicators indicate decreasing volatility and a period of consolidation.
- Volume indicators suggest positive accumulation and buying pressure.
Conclusion:
Based on the analysis of technical indicators, the next few days for PCEF are likely to see sideways movement with a slight bullish bias. The stock is expected to consolidate within a narrow range, supported by positive accumulation and buying pressure. Traders may consider maintaining a neutral to slightly bullish stance, with close monitoring of key support and resistance levels.