Technical Analysis of PCIG 2024-05-10
Overview:
In analyzing the technical indicators for PCIG over the last 5 days, we will delve into the trend, momentum, volatility, and volume indicators to provide a comprehensive outlook on the possible stock price movement in the coming days.
Trend Analysis:
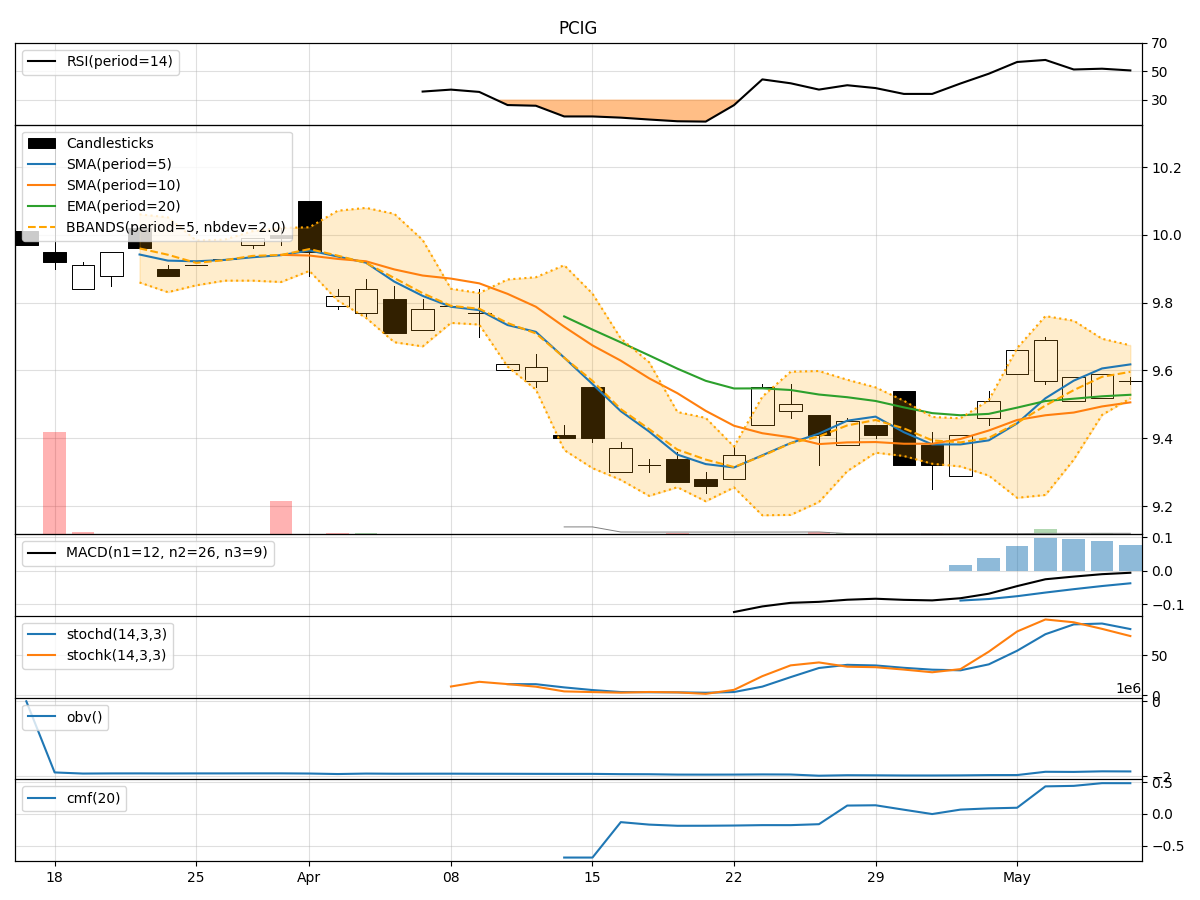
- Moving Averages (MA): The 5-day Moving Average (MA) has been consistently above the Simple Moving Average (SMA) and Exponential Moving Average (EMA), indicating a short-term bullish trend.
- MACD: The MACD line has been below the signal line but showing signs of convergence, suggesting a potential shift towards a bullish momentum.
- MACD Histogram: The MACD Histogram has been gradually decreasing but remains in positive territory, indicating a weakening bullish momentum.
Momentum Analysis:
- RSI: The Relative Strength Index (RSI) has been fluctuating around the 50 level, indicating a neutral momentum with no clear overbought or oversold conditions.
- Stochastic Oscillator: Both %K and %D lines of the Stochastic Oscillator have been declining, signaling a bearish momentum.
- Williams %R: The Williams %R is in oversold territory, suggesting a potential reversal in the short term.
Volatility Analysis:
- Bollinger Bands (BB): The Bollinger Bands have been narrowing, indicating decreasing volatility and a possible period of consolidation.
- BB %B: The %B indicator is hovering around the middle band, reflecting a balanced market sentiment.
- BB Width: The Bollinger Bands Width has been contracting, suggesting a potential breakout or significant price movement ahead.
Volume Analysis:
- On-Balance Volume (OBV): The OBV has been slightly declining, indicating a decrease in buying pressure.
- Chaikin Money Flow (CMF): The CMF has been positive, suggesting that money is flowing into the stock despite the recent price fluctuations.
Conclusion:
Based on the analysis of the technical indicators, the stock of PCIG is likely to experience sideways movement in the next few days. The trend indicators show a potential shift towards a bullish momentum, supported by the convergence in the MACD. However, the momentum indicators suggest a bearish sentiment, especially with the Stochastic Oscillator in oversold territory. The volatility indicators point towards a period of consolidation, while the volume indicators indicate a slight decrease in buying pressure.
Therefore, it is recommended to exercise caution and closely monitor the price action of PCIG in the coming days. Traders may consider waiting for confirmation of a clear trend direction before making significant trading decisions.