Technical Analysis of PCRB 2024-05-10
Overview:
In analyzing the technical indicators for PCRB over the last 5 days, we will delve into the trend, momentum, volatility, and volume indicators to provide a comprehensive outlook on the possible stock price movement in the coming days. By examining these key aspects, we aim to offer valuable insights and recommendations for your investment decisions.
Trend Analysis:
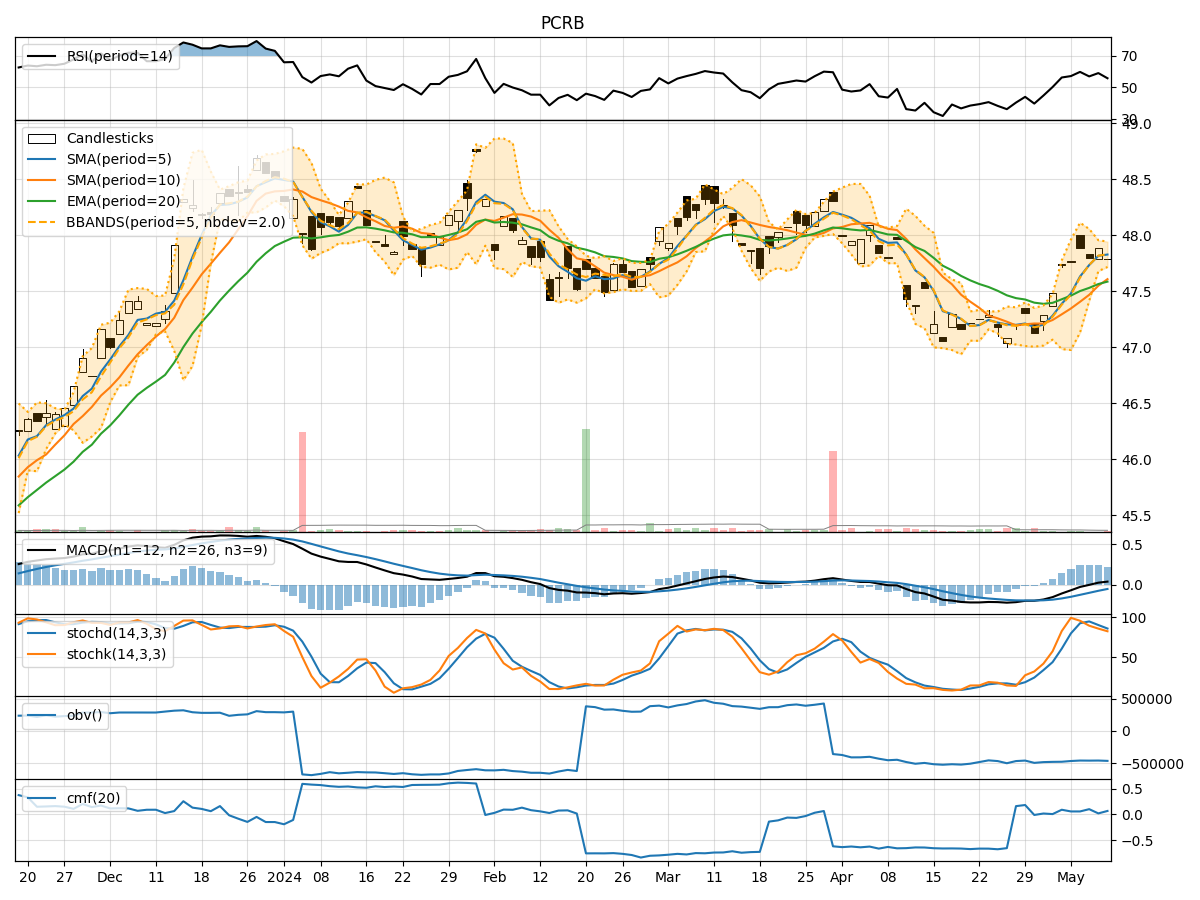
- Moving Averages (MA): The 5-day MA has been consistently above the 10-day SMA, indicating a short-term bullish trend. The EMA(20) has shown a slight upward trajectory, suggesting a positive momentum.
- MACD: The MACD line has been above the signal line, with both lines showing an upward trend. The MACD histogram has been increasing, indicating strengthening bullish momentum.
Momentum Analysis:
- RSI: The RSI has been fluctuating around the overbought territory, suggesting a strong bullish momentum in the short term.
- Stochastic Oscillator: Both %K and %D lines have been in the overbought zone, indicating a potential reversal or consolidation in the near future.
- Williams %R: The indicator has been hovering in the oversold region, signaling a potential buying opportunity.
Volatility Analysis:
- Bollinger Bands (BB): The stock price has been trading within the bands, with the upper and lower bands narrowing, indicating decreasing volatility.
- Bollinger %B: The %B indicator has been fluctuating around the middle range, suggesting a balanced market sentiment.
Volume Analysis:
- On-Balance Volume (OBV): The OBV has shown a slight increase, indicating accumulation by investors.
- Chaikin Money Flow (CMF): The CMF has been positive, reflecting buying pressure in the market.
Key Observations:
- The trend indicators suggest a bullish sentiment in the short term, supported by the moving averages and MACD.
- Momentum indicators point towards a potential reversal or consolidation due to overbought conditions in the stochastic oscillator.
- Volatility indicators indicate decreasing price fluctuations, possibly leading to a period of consolidation.
- Volume indicators show a slight increase in buying pressure, supporting the bullish bias.
Conclusion:
Based on the analysis of the technical indicators, the short-term outlook for PCRB is bullish with a potential for further upside movement in the stock price. However, caution is advised as the stochastic oscillator signals a possible reversal or consolidation. Traders may consider taking profits or implementing risk management strategies in case of a market correction. Overall, the stock is likely to experience upward momentum in the coming days.