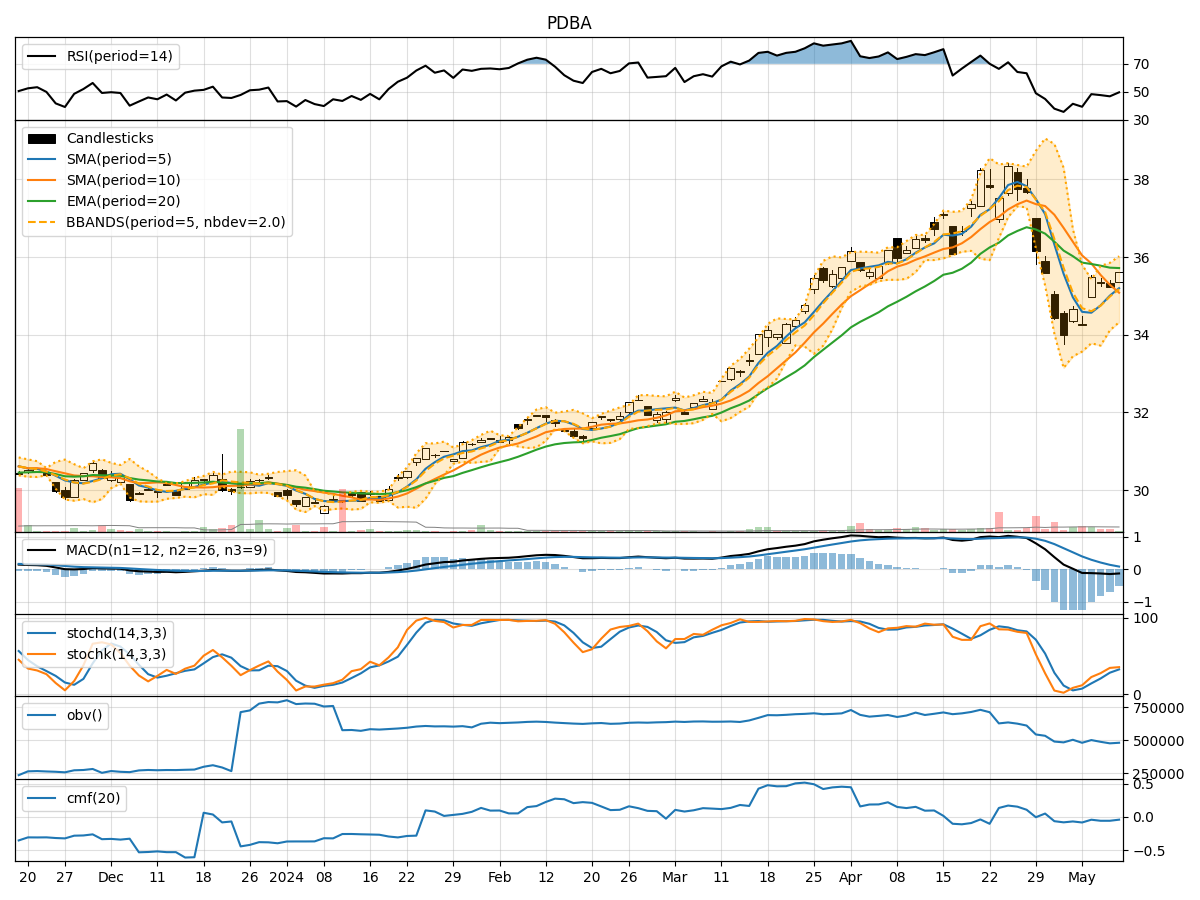
Technical Analysis of PDBA 2024-05-10
Overview:
In analyzing the technical indicators for PDBA stock over the last 5 days, we will delve into the trends, momentum, volatility, and volume indicators to provide a comprehensive outlook on the possible stock price movement in the coming days. By examining these key aspects, we aim to offer valuable insights and predictions for informed decision-making.
Trend Indicators:
- Moving Averages (MA): The 5-day moving average (MA) has been below the simple moving average (SMA) and exponential moving average (EMA) consistently, indicating a downward trend.
- MACD: The MACD line has been consistently below the signal line, suggesting a bearish momentum in the stock price.
- Conclusion: The trend indicators point towards a downward trajectory for the stock price.
Momentum Indicators:
- RSI: The Relative Strength Index (RSI) has been fluctuating around the neutral zone, indicating a lack of strong momentum in either direction.
- Stochastic Oscillator: Both %K and %D have been relatively low, suggesting a lack of strong buying or selling pressure.
- Conclusion: The momentum indicators reflect a sideways movement with no clear direction.
Volatility Indicators:
- Bollinger Bands: The stock price has been trading within the Bollinger Bands, with the bands narrowing, indicating decreasing volatility.
- Conclusion: Volatility is decreasing, signaling a potential consolidation phase in the stock price.
Volume Indicators:
- On-Balance Volume (OBV): The OBV has been consistently negative, indicating more selling volume than buying volume.
- Chaikin Money Flow (CMF): The CMF has been negative, suggesting a lack of buying pressure.
- Conclusion: Volume indicators point towards a bearish sentiment in the stock.
Overall Conclusion:
Based on the analysis of trend, momentum, volatility, and volume indicators, the next few days' possible stock price movement for PDBA is likely to be downward with a sideways momentum and consolidation phase. The decreasing volatility and bearish sentiment in volume indicators support this view. Traders and investors should exercise caution and consider potential short-term bearish positions or wait for a clearer trend to emerge before making significant investment decisions.
Key Recommendations:
- Monitor the trend closely for any potential reversal signals.
- Keep an eye on key support levels for possible entry points.
- Consider implementing risk management strategies to protect against potential downside risks.
- Stay updated on any significant news or events that could impact the stock price movement.
By staying informed and utilizing a combination of technical analysis tools, traders can navigate the market dynamics effectively and make well-informed decisions aligned with their investment goals.