Technical Analysis of PDN 2024-05-10
Overview:
In analyzing the technical indicators for PDN over the last 5 days, we will delve into the trend, momentum, volatility, and volume indicators to provide a comprehensive assessment of the stock's potential price movement. By examining these key factors, we aim to offer valuable insights and predictions for the next few days.
Trend Analysis:
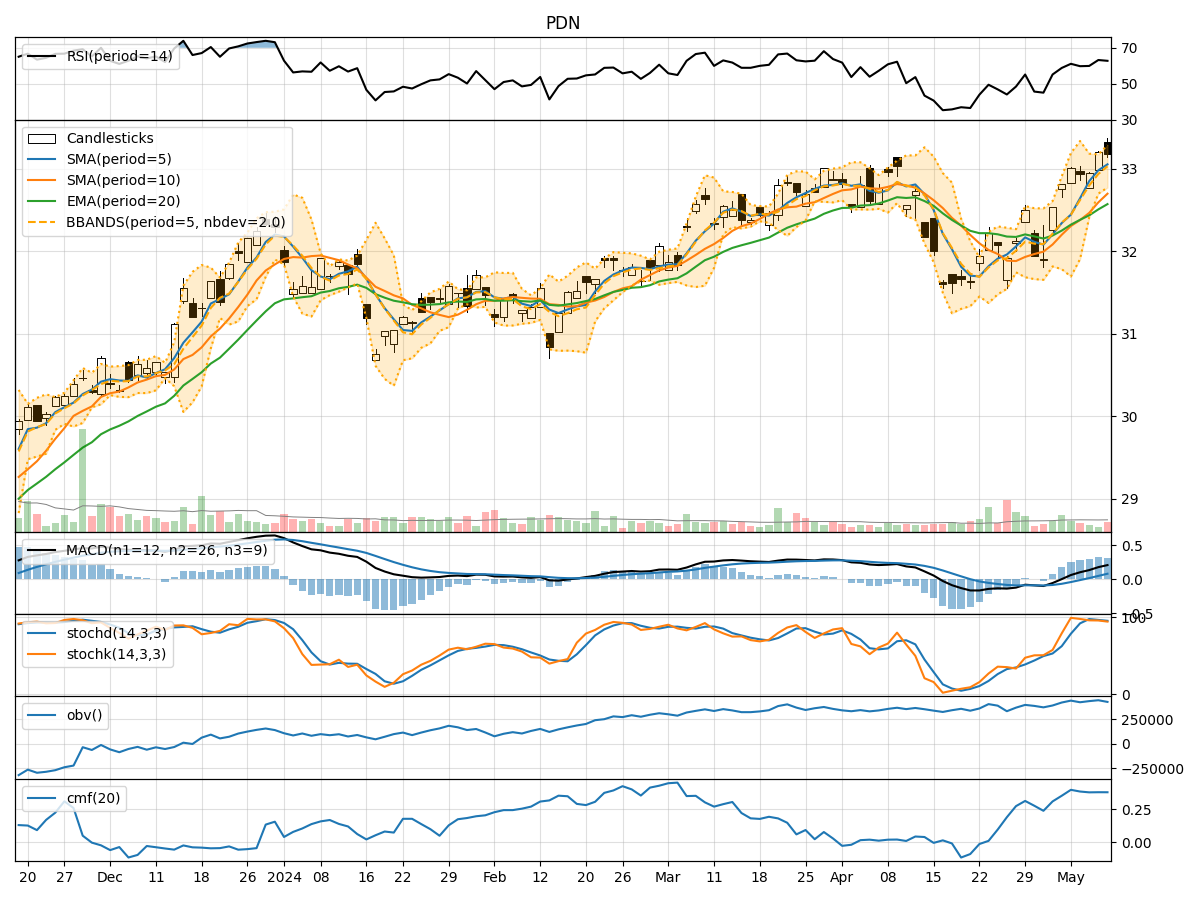
- Moving Averages (MA): The 5-day Moving Average (MA) has been consistently above the Simple Moving Average (SMA) and Exponential Moving Average (EMA), indicating a bullish trend.
- MACD: The MACD line has been consistently above the signal line, with both lines showing an upward trend, suggesting bullish momentum.
Momentum Analysis:
- RSI: The Relative Strength Index (RSI) has been fluctuating around the 60-65 range, indicating a neutral to slightly bullish momentum.
- Stochastic Oscillator: Both %K and %D have been in the overbought zone, suggesting a potential reversal or consolidation.
Volatility Analysis:
- Bollinger Bands (BB): The stock price has been trading within the Bollinger Bands, with the bands narrowing, indicating decreasing volatility.
Volume Analysis:
- On-Balance Volume (OBV): The OBV has shown a slight increase over the last 5 days, indicating accumulation by investors.
- Chaikin Money Flow (CMF): The CMF has been positive, suggesting buying pressure in the stock.
Key Observations:
- The trend indicators suggest a strong bullish sentiment in the short term.
- Momentum indicators show a neutral to slightly bullish momentum, with a possibility of a reversal due to overbought conditions.
- Volatility has been decreasing, indicating a potential period of consolidation.
- Volume indicators point towards accumulation and buying pressure in the stock.
Conclusion:
Based on the analysis of the technical indicators, the next few days' possible stock price movement for PDN is likely to be bullish in the short term. However, caution is advised as the stock may experience a period of consolidation or a potential reversal due to overbought conditions indicated by the momentum indicators. Traders and investors should closely monitor the price action and key support/resistance levels for timely decision-making.