Technical Analysis of PEMX 2024-05-10
Overview:
In analyzing the technical indicators for PEMX stock over the last 5 days, we will delve into the trend, momentum, volatility, and volume indicators to provide a comprehensive outlook on the possible stock price movement in the coming days. By examining these key indicators, we aim to offer valuable insights and predictions for potential investors or traders.
Trend Analysis:
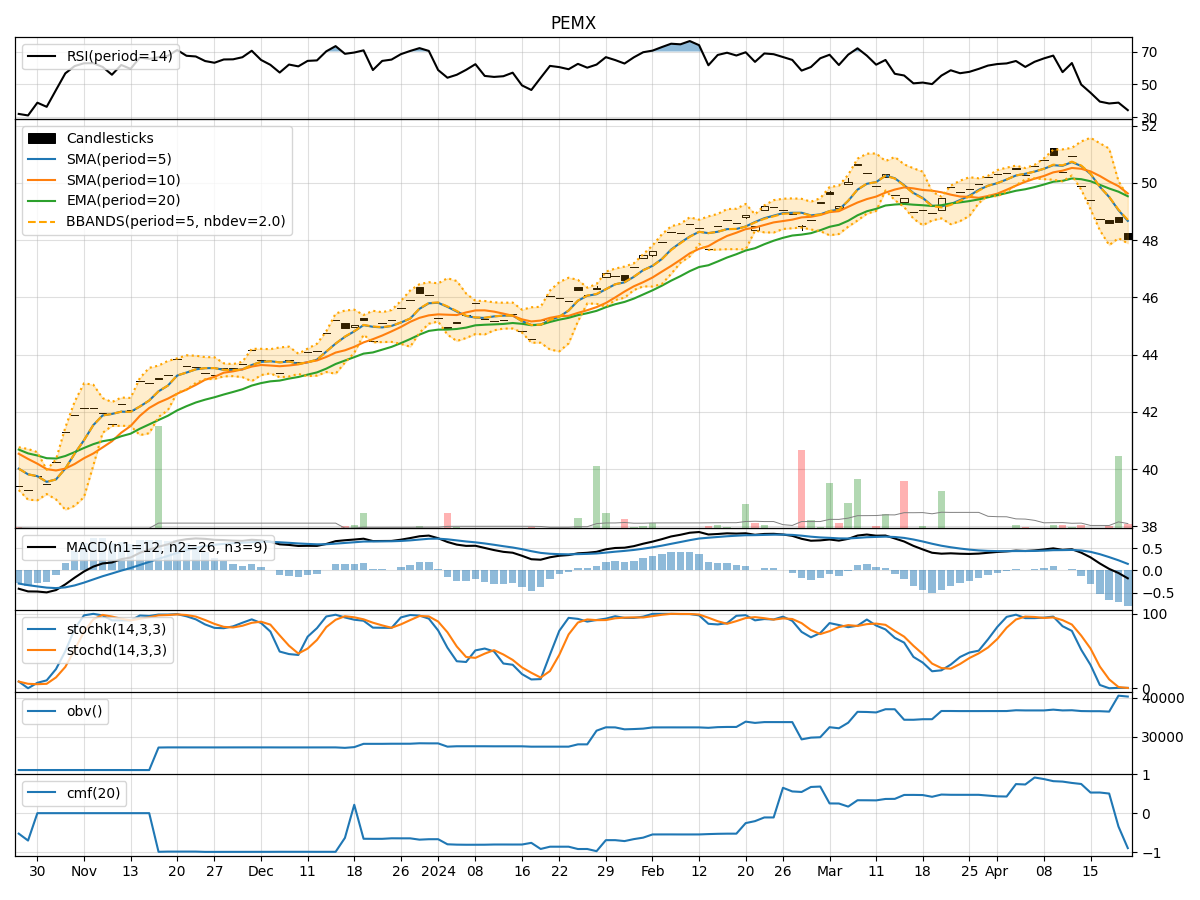
- Moving Averages (MA): The 5-day Moving Average (MA) has been consistently above the Simple Moving Average (SMA) and Exponential Moving Average (EMA), indicating a bullish trend.
- MACD: The MACD line has been above the signal line, with both lines showing an upward trend, suggesting positive momentum in the stock price.
- RSI: The Relative Strength Index (RSI) has been fluctuating around the 60-70 range, indicating a neutral to slightly bullish sentiment.
Momentum Analysis:
- Stochastic Oscillator: The Stochastic Oscillator has been gradually decreasing, moving from overbought to oversold territory, signaling a potential reversal in momentum.
- Williams %R: The Williams %R indicator has been consistently in oversold territory, suggesting a bearish sentiment in the short term.
Volatility Analysis:
- Bollinger Bands: The Bollinger Bands have been relatively narrow, indicating low volatility in the stock price.
- Bollinger %B: The %B indicator has been hovering around the middle range, suggesting a balanced market sentiment.
Volume Analysis:
- On-Balance Volume (OBV): The OBV indicator has been relatively stable, indicating a neutral volume trend.
- Chaikin Money Flow (CMF): The CMF has been negative, indicating a bearish money flow in the stock.
Conclusion:
Based on the analysis of the technical indicators, the stock price of PEMX is likely to experience sideways consolidation in the coming days. The bullish trend indicated by moving averages and MACD may be offset by the bearish momentum suggested by the Stochastic Oscillator and Williams %R. The low volatility and neutral volume further support the view of a sideways movement.
Key Takeaway: The stock is expected to trade within a narrow range without a clear directional bias. Traders may consider range-bound strategies, while investors should monitor for a breakout or breakdown from the consolidation phase before making significant decisions.