Technical Analysis of PEX 2024-05-10
Overview:
In analyzing the technical indicators for PEX stock over the last 5 days, we will delve into the trend, momentum, volatility, and volume indicators to provide a comprehensive outlook on the possible stock price movement in the coming days. By examining these key indicators, we aim to offer valuable insights and predictions to guide your investment decisions.
Trend Indicators:
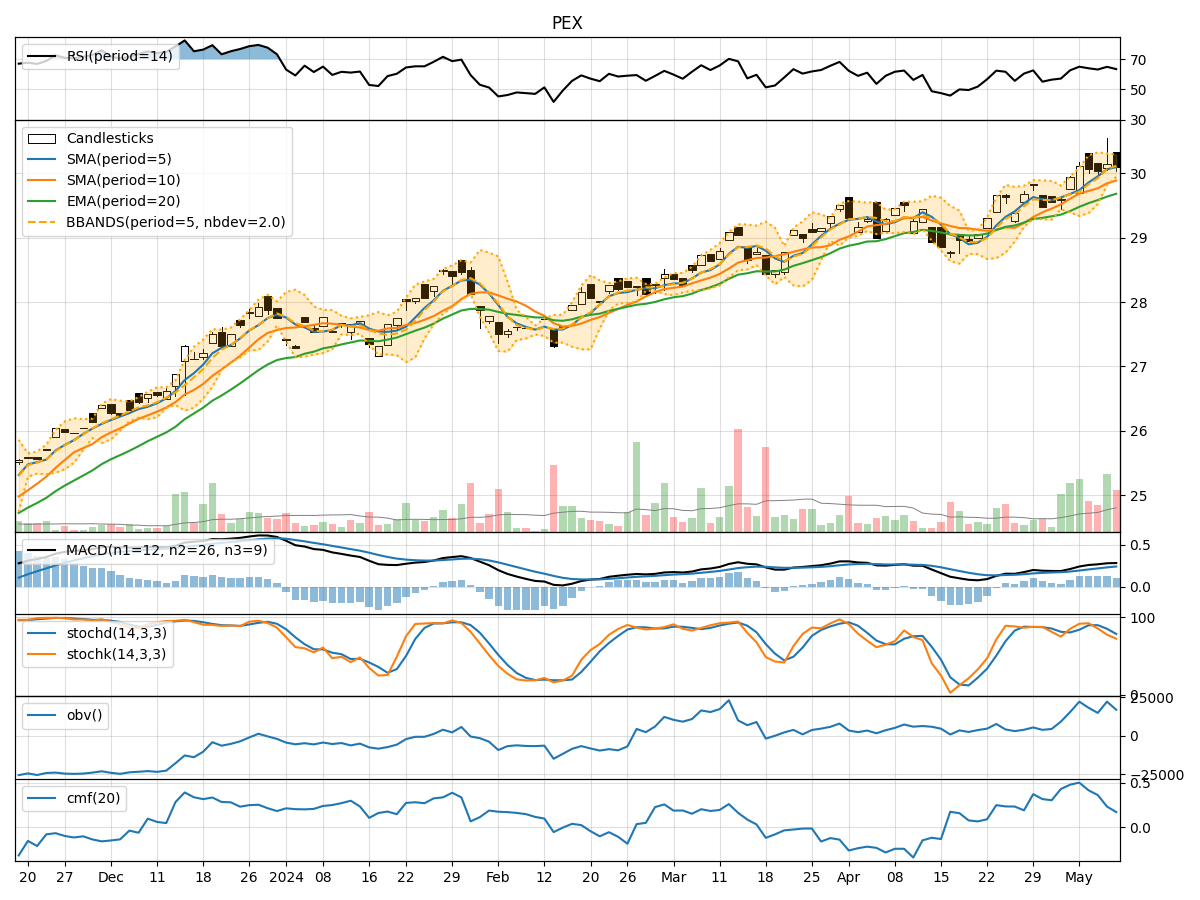
- Moving Averages (MA): The 5-day MA has been consistently above the closing prices, indicating a bullish trend.
- MACD: The MACD line has been above the signal line, suggesting a positive momentum in the stock price.
- EMA: The EMA has been steadily increasing, reflecting a bullish sentiment in the market.
Momentum Indicators:
- RSI: The RSI has been fluctuating around the overbought territory, indicating strong buying momentum.
- Stochastic Oscillator: Both %K and %D have been declining, signaling a potential reversal in the stock price.
- Williams %R: The indicator has been in the oversold region, suggesting a possible buying opportunity.
Volatility Indicators:
- Bollinger Bands: The stock price has been trading within the bands, indicating a period of consolidation.
- Bollinger %B: The %B indicator has been hovering around the middle range, suggesting a balanced market sentiment.
Volume Indicators:
- On-Balance Volume (OBV): The OBV has been relatively stable, indicating consistent buying pressure.
- Chaikin Money Flow (CMF): The CMF has been positive, reflecting a healthy inflow of money into the stock.
Key Observations:
- The trend indicators point towards a bullish sentiment in the market, supported by the moving averages and MACD.
- Momentum indicators show a mixed signal, with RSI indicating strong buying momentum but stochastic oscillators hinting at a potential reversal.
- Volatility indicators suggest a period of consolidation, with the stock price trading within the Bollinger Bands.
- Volume indicators indicate a stable buying pressure, supported by the OBV and CMF.
Conclusion:
Based on the analysis of the technical indicators, the stock price is likely to experience a period of consolidation in the coming days. While the trend indicators remain bullish, the mixed signals from momentum indicators and the consolidation pattern indicated by volatility indicators suggest a potential sideways movement in the stock price. Investors should closely monitor the stochastic oscillators for any signs of a reversal and consider the stable buying pressure reflected in the volume indicators. Overall, a cautious approach with a focus on risk management is advisable in the current market scenario.