Technical Analysis of PEY 2024-05-10
Overview:
In analyzing the technical indicators for PEY over the last 5 days, we will delve into the trend, momentum, volatility, and volume indicators to provide a comprehensive outlook on the possible stock price movement in the coming days. By examining these key aspects, we aim to offer valuable insights and predictions for potential investors.
Trend Analysis:
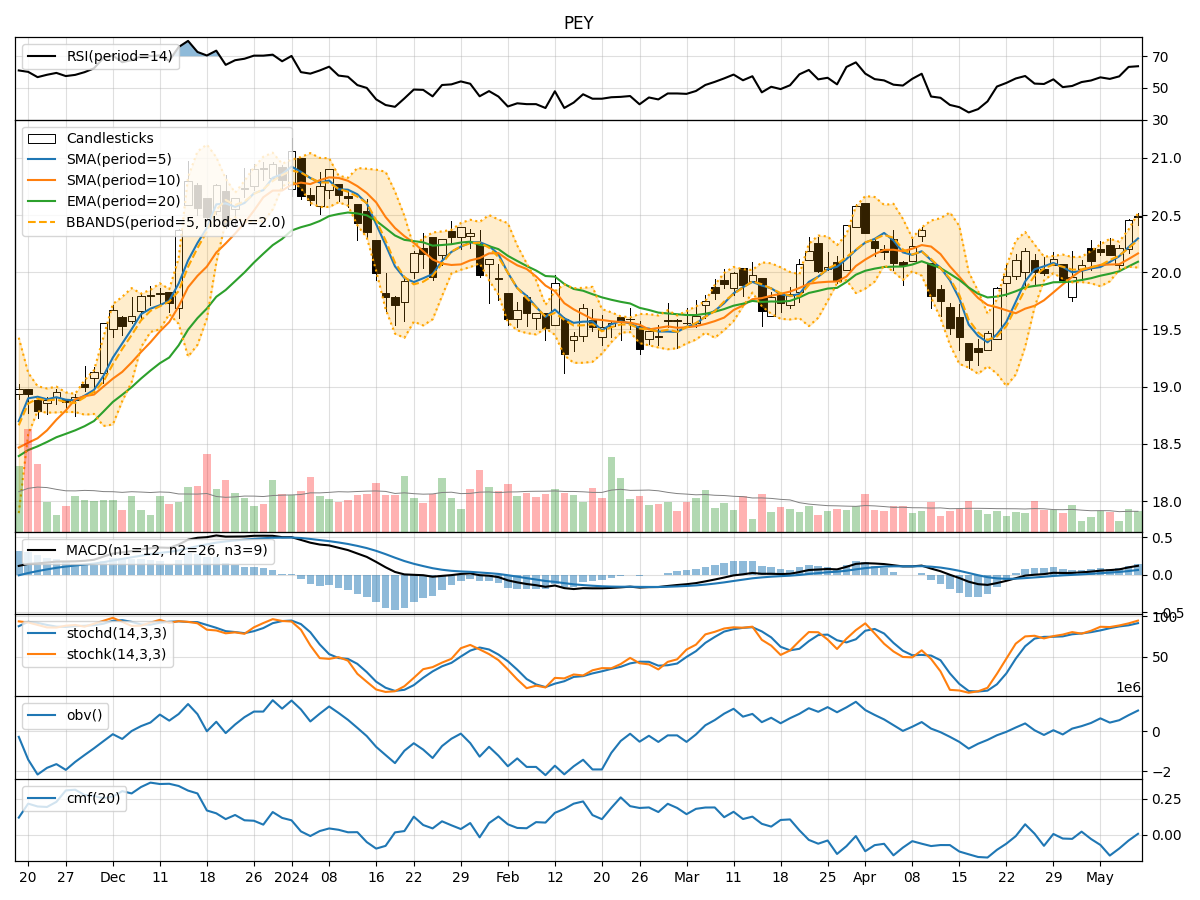
- Moving Averages (MA): The 5-day Moving Average (MA) has been consistently above the Simple Moving Average (SMA) and Exponential Moving Average (EMA) over the past 5 days, indicating a bullish trend.
- MACD: The Moving Average Convergence Divergence (MACD) has shown positive values, with the MACD line consistently above the Signal line, suggesting upward momentum in the stock price.
Momentum Analysis:
- RSI: The Relative Strength Index (RSI) has been fluctuating around the 60-70 range, indicating a neutral momentum in the stock.
- Stochastic Oscillator: Both %K and %D lines of the Stochastic Oscillator have been in the overbought zone, suggesting a potential reversal or consolidation in the stock price.
Volatility Analysis:
- Bollinger Bands: The stock price has been trading within the Bollinger Bands, with the bands widening slightly, indicating increased volatility in the stock.
- Bollinger %B: The %B indicator has been hovering around 0.8, suggesting that the stock is trading near the upper band, potentially indicating an overbought condition.
Volume Analysis:
- On-Balance Volume (OBV): The OBV indicator has shown a slight increase over the past 5 days, indicating a positive volume flow into the stock.
- Chaikin Money Flow (CMF): The CMF has been negative, suggesting a bearish pressure on the stock price.
Conclusion:
Based on the analysis of the technical indicators, the stock of PEY is currently in a bullish trend supported by the moving averages and MACD. However, the momentum indicators like RSI and Stochastic Oscillator suggest a potential reversal or consolidation in the stock price due to overbought conditions. The volatility indicators point towards increased volatility in the stock, while the volume indicators show a mixed signal with OBV slightly positive and CMF negative.
Recommendation:
Considering the overall analysis, it is advisable to exercise caution in trading PEY in the next few days. Investors should closely monitor the price action for any signs of a reversal or consolidation. It is recommended to wait for confirmation from momentum indicators before making any significant trading decisions.