Technical Analysis of PFEB 2024-05-10
Overview:
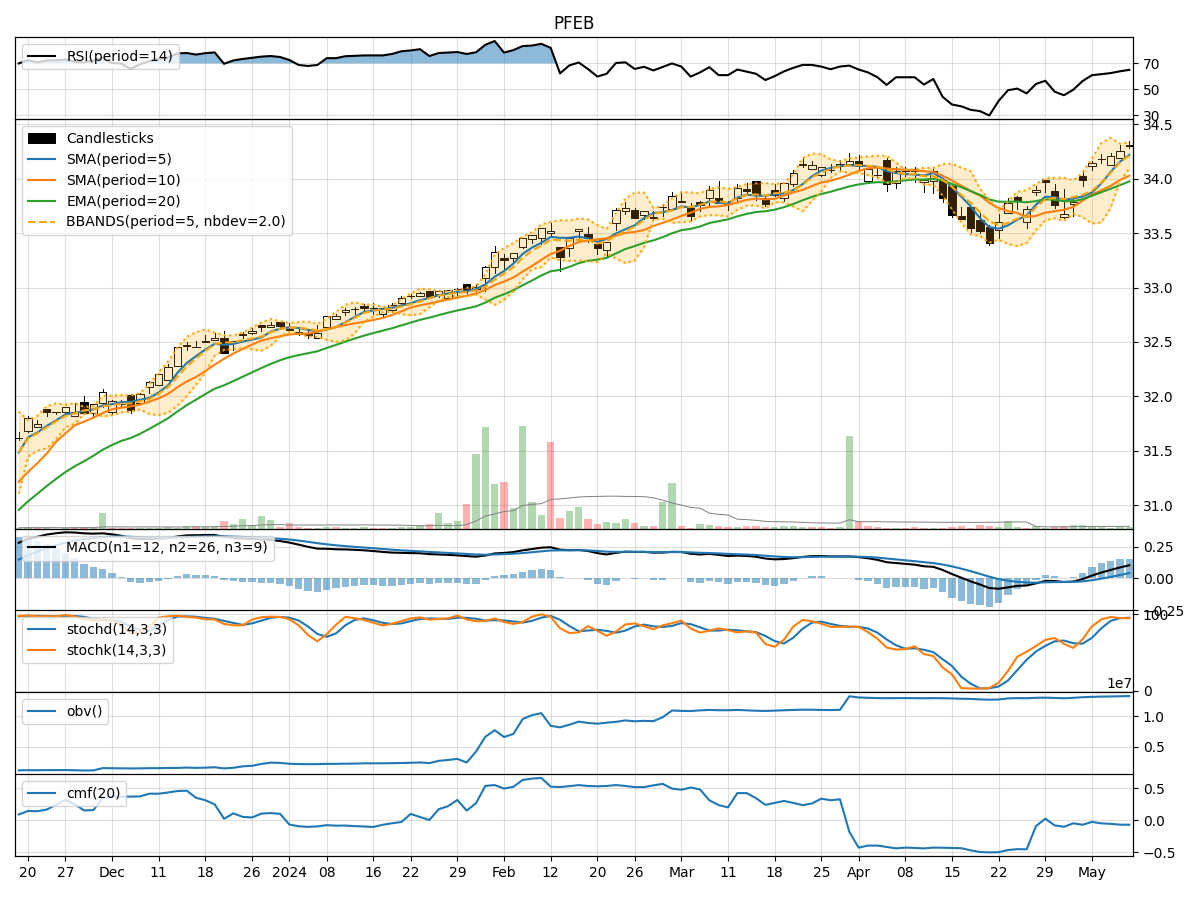
In analyzing the technical indicators for PFEB stock over the last 5 days, we will delve into the trends, momentum, volatility, and volume aspects to provide a comprehensive outlook on the possible stock price movement in the coming days. By examining key indicators such as moving averages, MACD, RSI, Bollinger Bands, and OBV, we aim to offer valuable insights and predictions for potential price action.
Trend Analysis:
- Moving Averages (MA): The 5-day moving average has been consistently above the simple moving average (SMA) and exponential moving average (EMA), indicating a bullish trend.
- MACD: The MACD line has been consistently above the signal line, with increasing values, suggesting a strengthening bullish momentum.
Momentum Analysis:
- RSI: The Relative Strength Index (RSI) has been trending upwards, indicating increasing buying pressure and potential overbought conditions.
- Stochastic Oscillator: Both %K and %D have been in the overbought zone, signaling a strong bullish momentum.
Volatility Analysis:
- Bollinger Bands: The stock price has been consistently trading above the middle Bollinger Band (BBM), with the bands narrowing, suggesting a period of low volatility.
Volume Analysis:
- On-Balance Volume (OBV): The OBV indicator has been steadily increasing, indicating strong buying volume supporting the price uptrend.
Key Observations:
- The stock is currently in a strong bullish trend based on moving averages and MACD.
- Momentum indicators like RSI and Stochastic Oscillator suggest overbought conditions, which could lead to a potential pullback.
- Volatility is low as indicated by the narrowing Bollinger Bands, signaling a period of consolidation.
- Increasing OBV reflects strong buying volume, supporting the bullish trend.
Conclusion:
Based on the analysis of technical indicators, the stock is likely to experience a short-term pullback or consolidation due to overbought conditions indicated by momentum indicators like RSI and Stochastic Oscillator. However, the overall trend remains bullish supported by moving averages and strong buying volume depicted by OBV. Traders should be cautious of a potential correction in the near term, but the long-term outlook remains positive.