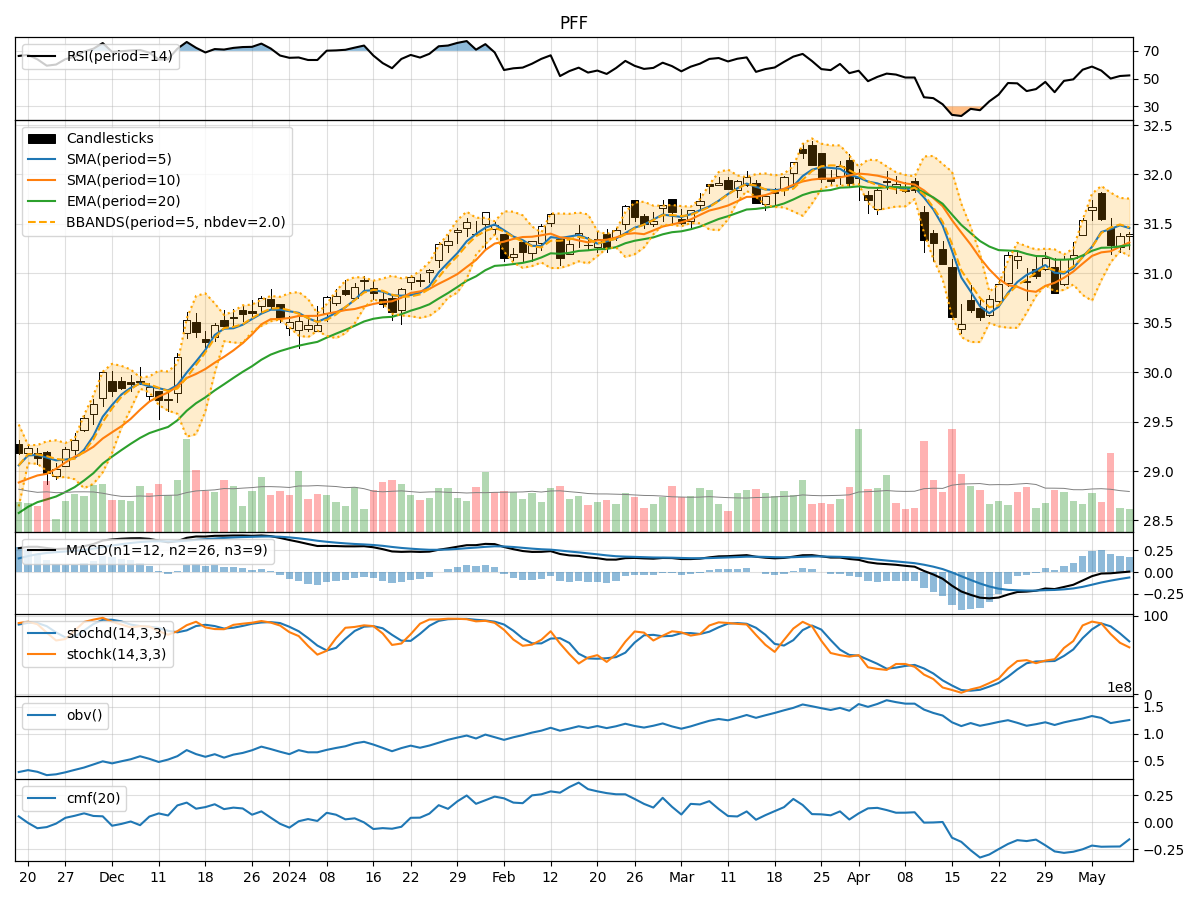
Technical Analysis of PFF 2024-05-10
Overview:
In the last 5 trading days, PFF stock has shown mixed signals across various technical indicators. The trend indicators suggest a slightly bullish sentiment, with the moving averages showing a slight uptrend. Momentum indicators indicate a neutral to slightly bearish sentiment, with RSI hovering around the mid-level. Volatility indicators show a decreasing trend in volatility. Volume indicators suggest a slight decrease in buying pressure.
Trend Analysis:
- Moving Averages (MA): The 5-day MA is slightly above the 10-day SMA, indicating a short-term bullish trend.
- MACD: The MACD line is slightly above the signal line, suggesting a potential bullish momentum.
- EMA: The EMA is showing a gradual uptrend, indicating a positive sentiment in the medium term.
Momentum Analysis:
- RSI: The RSI is around 50, indicating a neutral sentiment with no clear overbought or oversold conditions.
- Stochastic Oscillator: Both %K and %D are trending downwards, suggesting a weakening momentum.
- Williams %R: The Williams %R is close to the oversold territory, indicating a potential buying opportunity.
Volatility Analysis:
- Bollinger Bands: The bands are narrowing, indicating decreasing volatility and a possible period of consolidation.
- Bollinger %B: The %B is below 1, suggesting the stock is trading below the lower band, potentially indicating an oversold condition.
Volume Analysis:
- On-Balance Volume (OBV): The OBV is showing a slight decrease, indicating a decrease in buying pressure.
- Chaikin Money Flow (CMF): The CMF is negative, suggesting a slight outflow of money from the stock.
Conclusion:
Based on the analysis of the technical indicators, the next few days for PFF stock are likely to see sideways movement with a slight bullish bias. The trend indicators point towards a potential uptrend, supported by the moving averages and MACD. However, the momentum indicators suggest a neutral to slightly bearish sentiment, indicating a lack of strong buying pressure. The decreasing volatility and slightly negative volume indicators further support the view of a consolidation phase.
Key Takeaways: - Trend: Slightly bullish - Momentum: Neutral to slightly bearish - Volatility: Decreasing, indicating consolidation - Volume: Slightly negative, suggesting reduced buying pressure
Overall, while there may be some upward potential in the short term, the overall outlook suggests a period of consolidation with limited upside momentum. Traders should watch for a breakout above key resistance levels to confirm a more sustained bullish trend.