Technical Analysis of PFFD 2024-05-10
Overview:
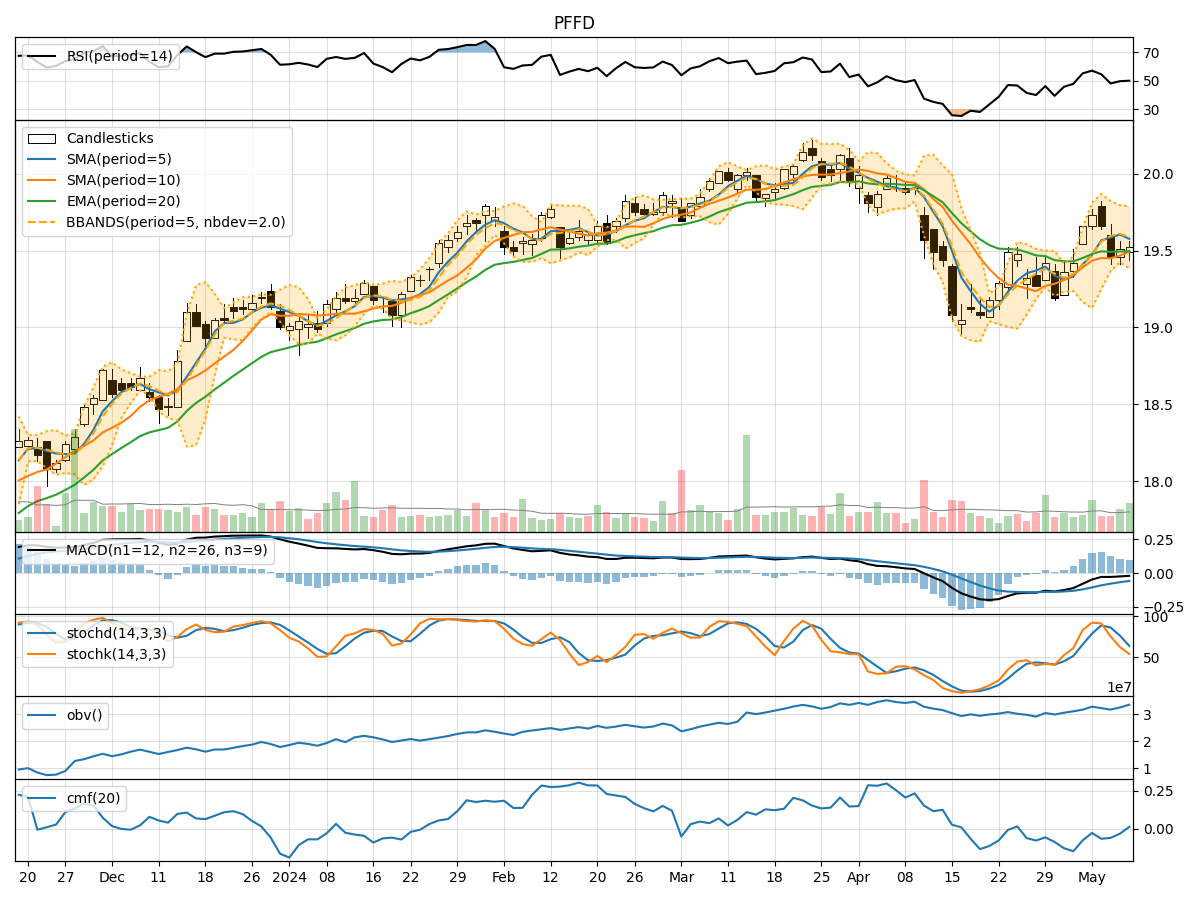
In the last 5 trading days, PFFD has shown mixed signals across various technical indicators. The stock price has been fluctuating within a narrow range, with some indicators suggesting potential bullish momentum while others indicating a possible consolidation phase. Let's delve deeper into each category of technical indicators to provide a comprehensive analysis and make a prediction for the next few days.
Trend Indicators:
- Moving Averages (MA): The 5-day MA has been hovering around the closing price, indicating short-term stability. However, the SMA(10) and EMA(20) are relatively close, suggesting a lack of strong trend direction.
- MACD: The MACD line has been consistently below the signal line, indicating a bearish trend. The MACD histogram has been decreasing, signaling a weakening bearish momentum.
Momentum Indicators:
- RSI: The RSI has been fluctuating around the 50 level, indicating indecision in the market. It has not reached overbought or oversold levels, suggesting a lack of strong momentum.
- Stochastic Oscillator: Both %K and %D have been declining, indicating a bearish momentum. The stock is currently in the oversold territory, but the %D line has not shown a clear reversal signal.
Volatility Indicators:
- Bollinger Bands: The stock price has been trading within the Bollinger Bands, with the bands narrowing, indicating decreasing volatility. The price is currently close to the lower band, suggesting a potential bounce or support level.
- Bollinger %B: The %B indicator is below 0.5, indicating that the stock is trading below the lower Bollinger Band, which could signal a potential oversold condition.
Volume Indicators:
- On-Balance Volume (OBV): The OBV has been fluctuating, indicating mixed buying and selling pressure. There is no clear trend in volume accumulation.
- Chaikin Money Flow (CMF): The CMF has been negative, indicating a lack of buying pressure. The indicator suggests that money is flowing out of the stock.
Conclusion:
Based on the analysis of the technical indicators, the next few days for PFFD could see sideways movement with a slight bearish bias. The lack of strong trend direction, mixed momentum signals, and decreasing volatility point towards a period of consolidation. Traders should exercise caution and wait for clearer signals before taking any significant positions. It is advisable to closely monitor key support and resistance levels for potential breakout or breakdown scenarios.