Technical Analysis of PFFL 2024-05-10
Overview:
In analyzing the technical indicators for PFFL over the last 5 days, we will delve into the trend, momentum, volatility, and volume indicators to provide a comprehensive outlook on the possible stock price movement in the coming days. By examining these key indicators, we aim to offer valuable insights and predictions for informed decision-making.
Trend Indicators:
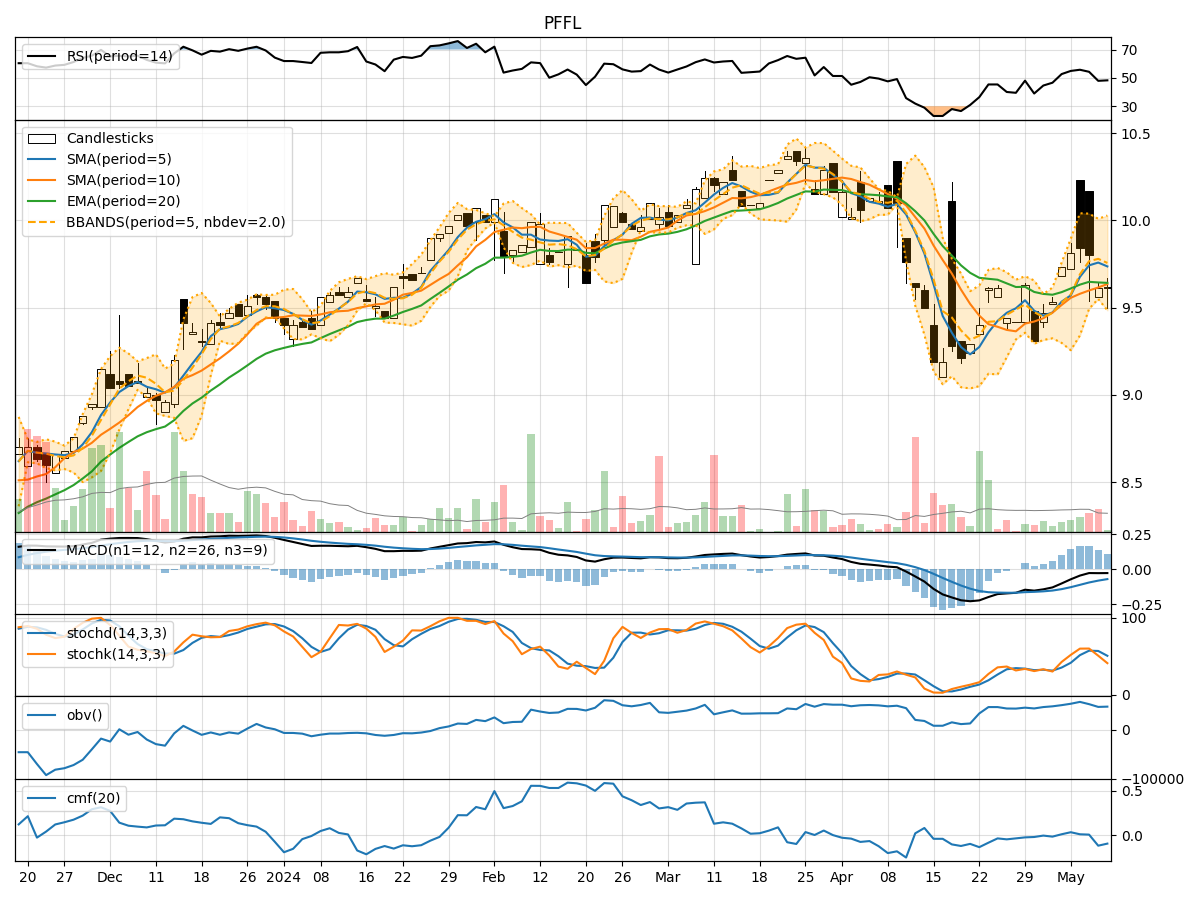
- Moving Averages (MA): The 5-day Moving Average (MA) has been fluctuating around the closing prices, indicating short-term price trends. The Simple Moving Average (SMA) and Exponential Moving Average (EMA) show a slight upward trend, suggesting potential bullish momentum.
- Moving Average Convergence Divergence (MACD): The MACD line has been consistently below the signal line, indicating a bearish trend. However, the MACD Histogram has shown signs of narrowing, hinting at a possible trend reversal.
Momentum Indicators:
- Relative Strength Index (RSI): The RSI has been hovering around the neutral zone, indicating a balanced momentum between buying and selling pressure.
- Stochastic Oscillator: Both %K and %D lines of the Stochastic Oscillator have been fluctuating, suggesting indecision in the market.
- Williams %R (Willams %R): The Williams %R has been in the oversold territory, indicating a potential buying opportunity.
Volatility Indicators:
- Bollinger Bands (BB): The Bollinger Bands have been narrowing, indicating decreasing volatility. The bands are currently close to the price, suggesting a potential breakout in either direction.
- Bollinger %B (BB %B): The %B indicator has been fluctuating around the middle line, reflecting uncertainty in price direction.
Volume Indicators:
- On-Balance Volume (OBV): The OBV has shown mixed signals, with fluctuations in volume accumulation. This indicates uncertainty among market participants.
- Chaikin Money Flow (CMF): The CMF has been negative, suggesting outflow of money from the stock. This could indicate weakening buying pressure.
Key Observations and Opinions:
- Trend: The trend indicators show a mixed picture, with a potential bullish bias in the short term due to the moving averages. However, the MACD signals caution with a bearish trend.
- Momentum: Momentum indicators suggest a lack of clear direction, with RSI indicating a balanced market sentiment. The oversold condition in Williams %R could signal a potential reversal.
- Volatility: Volatility indicators point towards decreasing volatility, which could precede a period of consolidation or a breakout.
- Volume: Volume indicators reflect uncertainty and lack of strong buying interest, as seen in the OBV and CMF.
Conclusion:
Based on the analysis of the technical indicators, the stock price of PFFL is likely to experience sideways movement in the coming days. The mixed signals from trend, momentum, volatility, and volume indicators suggest a lack of clear direction in the market. Traders and investors should exercise caution and wait for more definitive signals before making significant trading decisions.