Technical Analysis of PFI 2024-05-10
Overview:
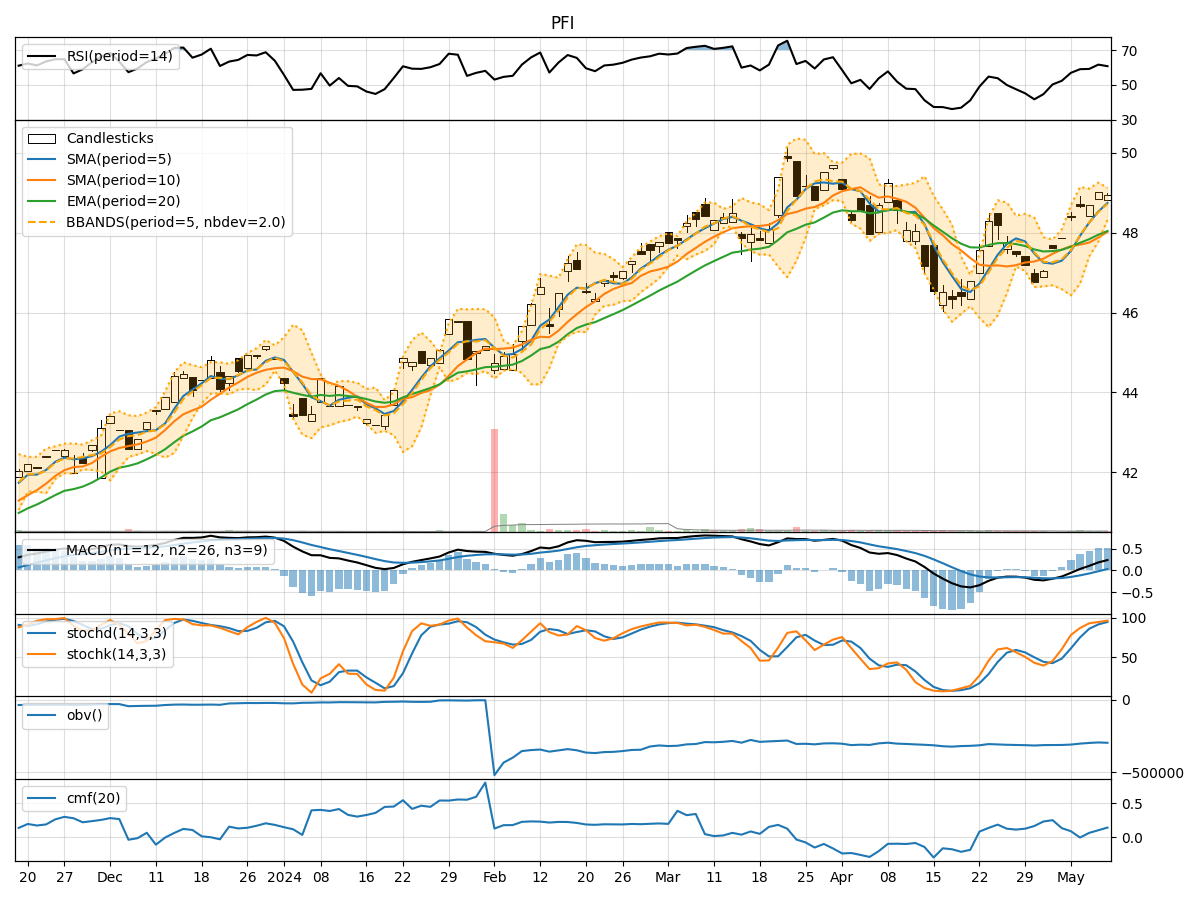
In analyzing the provided PFI TA data for the last 5 days, we will delve into the technical indicators across trend, momentum, volatility, and volume to derive insights into the possible future stock price movement. By examining these indicators, we aim to provide a comprehensive outlook on the stock's potential trajectory in the upcoming days.
Trend Analysis:
- Moving Averages (MA): The 5-day MA has been consistently above the closing prices, indicating a bullish trend.
- MACD: The MACD line has been consistently above the signal line, suggesting a bullish momentum.
- Relative Strength Index (RSI): The RSI values have been in the overbought territory, indicating a strong bullish momentum.
Key Observation: The trend indicators point towards a strong bullish sentiment in the stock price movement.
Momentum Analysis:
- Stochastic Oscillator: Both %K and %D values have been in the overbought zone, signaling a potential reversal or consolidation.
- Williams %R (WillR): The Williams %R has been fluctuating around the oversold region, indicating potential buying opportunities.
Key Observation: Momentum indicators suggest a possible short-term correction or consolidation in the stock price.
Volatility Analysis:
- Bollinger Bands (BB): The stock price has been trading within the upper Bollinger Band, indicating high volatility.
- Bollinger Band %B (BBP): The %B value has been fluctuating, suggesting potential price reversals.
Key Observation: Volatility indicators imply a volatile trading environment with potential price reversals.
Volume Analysis:
- On-Balance Volume (OBV): The OBV has shown a slight increase, indicating buying pressure.
- Chaikin Money Flow (CMF): The CMF has been positive, suggesting money flow into the stock.
Key Observation: Volume indicators reflect a positive sentiment with increasing buying pressure.
Conclusion:
Based on the analysis of the technical indicators, the stock is currently in a strong bullish trend with high volatility and positive volume inflow. However, the momentum indicators suggest a potential short-term correction or consolidation in the stock price.
Future Price Movement Prediction:
Considering the overall bullish trend and positive volume inflow, the stock is likely to experience further upward movement in the coming days. Traders should be cautious of the high volatility and potential short-term corrections, utilizing proper risk management strategies to capitalize on the bullish momentum.
Recommendation:
- Short-term Traders: Consider taking profits on overbought conditions and look for potential buying opportunities during corrections.
- Long-term Investors: Hold positions with a focus on the bullish trend, while monitoring for any signs of trend reversal.
Disclaimer:
Remember that market dynamics can change rapidly, and it is essential to monitor the stock closely for any shifts in the technical indicators. Always conduct thorough research and consider multiple factors before making investment decisions.