Technical Analysis of PFM 2024-05-10
Overview:
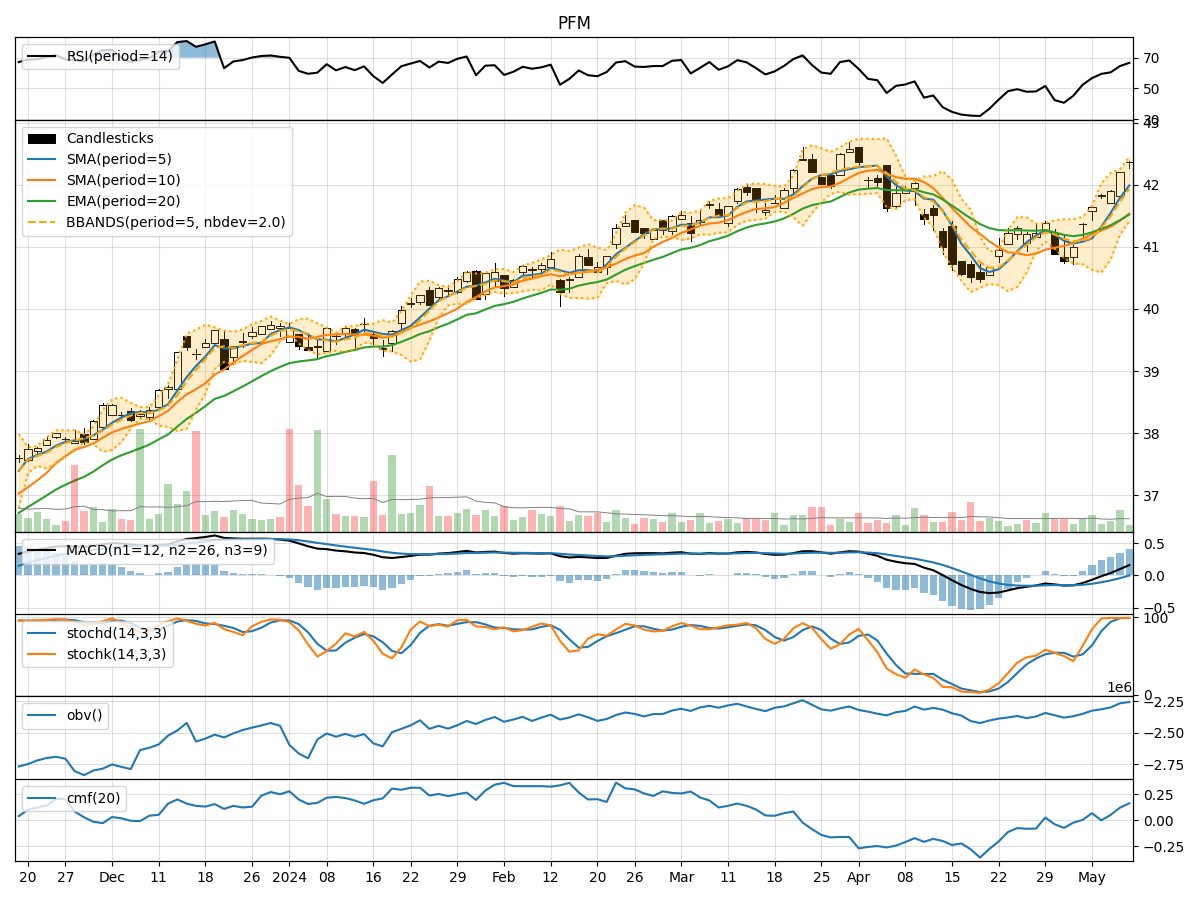
In analyzing the technical indicators for PFM stock over the last 5 days, we will delve into the trend, momentum, volatility, and volume indicators to provide a comprehensive outlook on the possible stock price movement in the coming days. By examining these key aspects, we aim to offer valuable insights and predictions for potential investors.
Trend Indicators:
- Moving Averages (MA): The 5-day MA has been consistently above the closing prices, indicating a short-term uptrend.
- MACD: The MACD line has been steadily increasing, with the MACD histogram showing positive values, suggesting bullish momentum.
- EMA: The EMA has been trending upwards, reflecting a positive price trend.
Key Observation: The trend indicators point towards a bullish sentiment in the short term.
Momentum Indicators:
- RSI: The RSI has been increasing, reaching levels above 50, indicating strengthening momentum.
- Stochastic Oscillator: Both %K and %D have been in the overbought zone, suggesting a potential reversal.
- Williams %R: The indicator has been hovering in the oversold territory, signaling a possible buying opportunity.
Key Observation: Momentum indicators show a mixed signal, with RSI indicating bullish momentum and Stochastic Oscillator hinting at a potential reversal.
Volatility Indicators:
- Bollinger Bands (BB): The stock price has been trading within the bands, with the %B indicator fluctuating around 1, indicating normal volatility.
- Average True Range (ATR): ATR values have been relatively stable, suggesting consistent price movements.
Key Observation: Volatility indicators suggest a stable price movement with no significant spikes or drops.
Volume Indicators:
- On-Balance Volume (OBV): The OBV has been increasing, indicating accumulation by investors.
- Chaikin Money Flow (CMF): The CMF has been positive, reflecting buying pressure in the market.
Key Observation: Volume indicators point towards positive investor sentiment and buying interest.
Conclusion:
Based on the analysis of the technical indicators, the overall outlook for PFM stock in the next few days appears to be bullish. The trend indicators support a continued uptrend, while momentum indicators show a mixed signal with potential for a reversal. Volatility indicators suggest stability in price movements, and volume indicators indicate positive investor sentiment.
Therefore, the next few days may see PFM stock price experiencing an upward movement with potential for a bullish trend continuation. Investors could consider monitoring the momentum indicators for any signs of a reversal and adjust their strategies accordingly.