Technical Analysis of PFUT 2024-05-10
Overview:
In analyzing the technical indicators for PFUT stock over the last 5 days, we will delve into the trends, momentum, volatility, and volume aspects to provide a comprehensive outlook on the possible stock price movement in the coming days.
Trend Analysis:
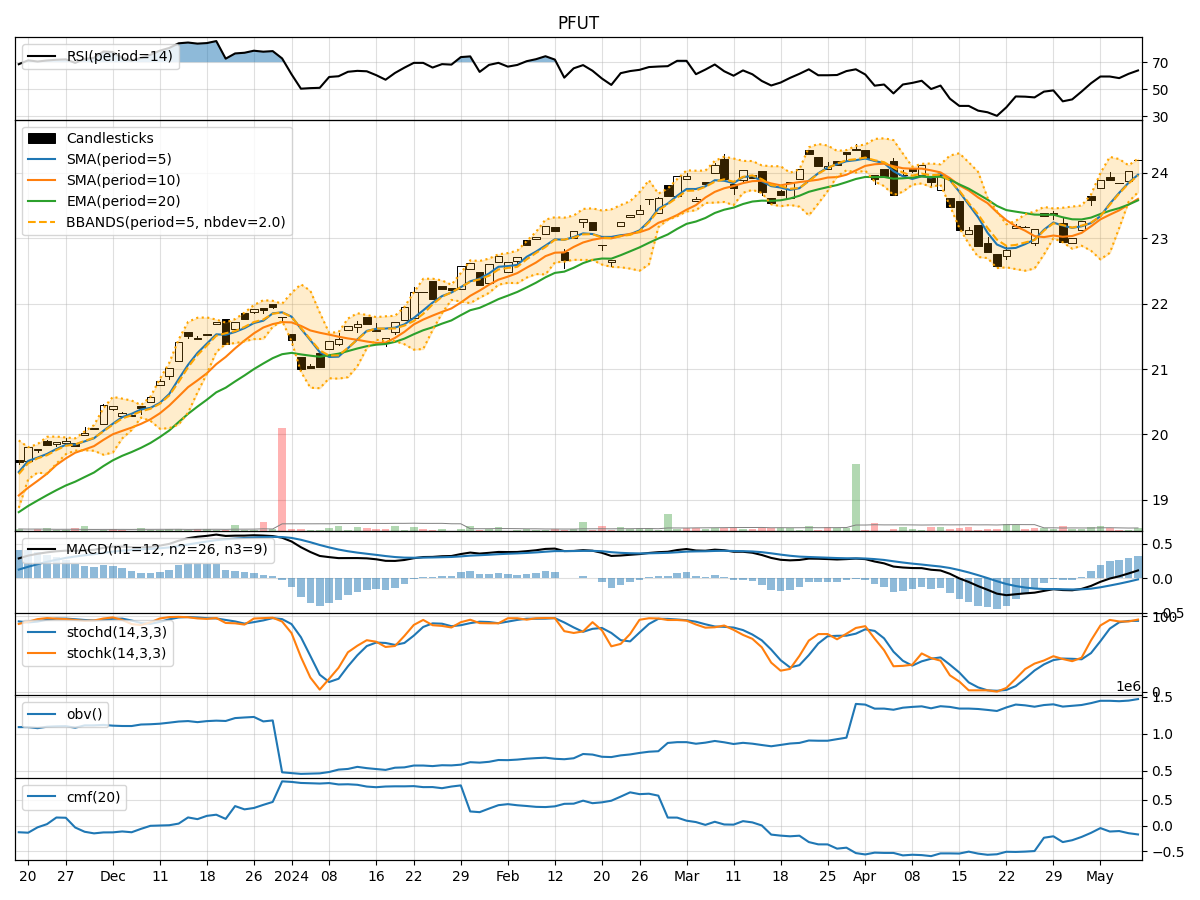
- Moving Averages (MA): The 5-day Moving Average (MA) has been consistently above the Simple Moving Average (SMA) and Exponential Moving Average (EMA), indicating a bullish trend.
- MACD: The MACD line has been consistently above the signal line, with both lines trending upwards, suggesting a bullish momentum.
- MACD Histogram: The MACD Histogram has been increasing, indicating strengthening bullish momentum.
Momentum Analysis:
- RSI: The Relative Strength Index (RSI) has been in the neutral zone around 60-65, suggesting a balanced momentum.
- Stochastic Oscillator: Both %K and %D lines of the Stochastic Oscillator have been in the overbought region, indicating a potential reversal or consolidation.
- Williams %R: The Williams %R has been hovering around -10 to -15, signaling an overbought condition.
Volatility Analysis:
- Bollinger Bands: The stock price has been trading within the Bollinger Bands, with the bands narrowing, indicating decreasing volatility.
- Bollinger %B: The %B indicator has been fluctuating around 0.8-0.9, suggesting the stock is trading near the upper band.
Volume Analysis:
- On-Balance Volume (OBV): The OBV has shown a slight decrease, indicating some distribution happening in the stock.
- Chaikin Money Flow (CMF): The CMF has been negative, suggesting outflow of money from the stock.
Key Observations:
- The trend indicators suggest a strong bullish sentiment in the stock.
- Momentum indicators show a potential overbought condition, signaling a need for caution.
- Volatility has been decreasing, indicating a possible period of consolidation.
- Volume indicators point towards some distribution and negative money flow.
Conclusion:
Based on the analysis of the technical indicators, the next few days for PFUT stock could see a potential consolidation phase with a slight downward bias. The stock has shown signs of being overbought, coupled with decreasing volatility and negative money flow, indicating a possible correction or sideways movement. Traders should exercise caution and consider taking profits or implementing risk management strategies in the current market environment.