Technical Analysis of PGHY 2024-05-10
Overview:
In analyzing the technical indicators for PGHY over the last 5 days, we will delve into the trend, momentum, volatility, and volume indicators to provide a comprehensive assessment of the stock's potential price movement. By examining these key factors, we aim to offer valuable insights and predictions for the next few days.
Trend Analysis:
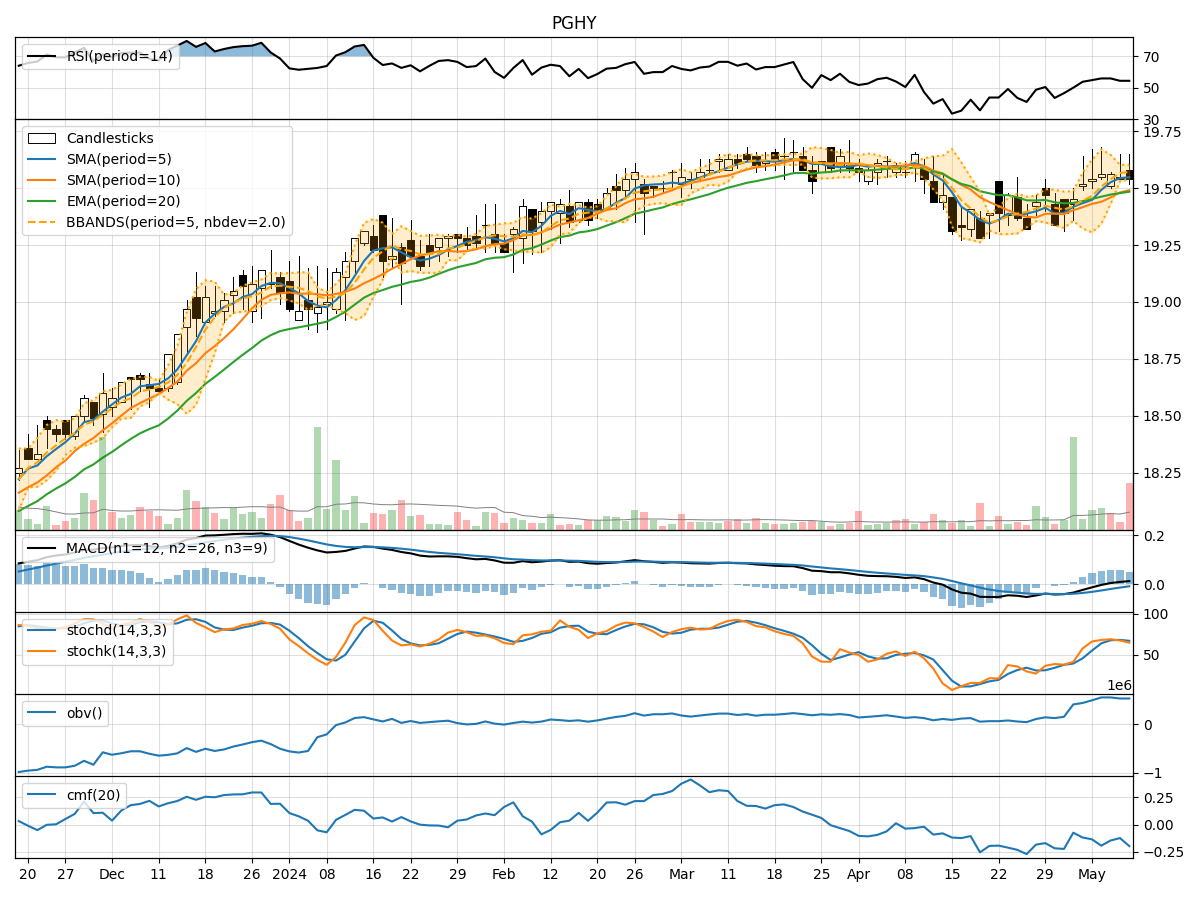
- Moving Averages (MA): The 5-day Moving Average (MA) has been consistently above the Simple Moving Average (SMA) and Exponential Moving Average (EMA), indicating a short-term uptrend.
- MACD: The MACD line has been consistently above the signal line, with both lines showing an upward trend, suggesting bullish momentum.
- MACD Histogram: The MACD Histogram has been increasing over the past 5 days, indicating strengthening bullish momentum.
Momentum Analysis:
- RSI: The Relative Strength Index (RSI) has been fluctuating around the 50 level, indicating a neutral momentum.
- Stochastic Oscillator: Both %K and %D lines of the Stochastic Oscillator have been declining, signaling a potential reversal in momentum.
- Williams %R: The Williams %R indicator has been hovering in the oversold territory, suggesting a possible bullish reversal.
Volatility Analysis:
- Bollinger Bands: The stock price has been trading within the Bollinger Bands, with the bands narrowing over the last few days, indicating decreasing volatility.
- Bollinger %B: The %B indicator has been gradually decreasing, suggesting a potential consolidation phase.
Volume Analysis:
- On-Balance Volume (OBV): The OBV indicator has been relatively stable, indicating a balance between buying and selling pressure.
- Chaikin Money Flow (CMF): The CMF has been negative, indicating a lack of buying pressure in the stock.
Conclusion:
Based on the analysis of the technical indicators, the next few days for PGHY could see sideways movement with a slight bullish bias. The trend indicators suggest a continuation of the short-term uptrend, supported by the MACD and moving averages. However, the momentum indicators show signs of potential reversal, which could lead to a brief consolidation phase. The volatility indicators point towards decreasing volatility, while the volume indicators indicate a lack of significant buying pressure.
In summary, while the stock may experience some fluctuations in momentum, the overall trend remains positive. Traders should monitor key support and resistance levels closely to capitalize on potential buying opportunities during any pullbacks. Consider a cautious approach with a slight bullish bias in the short term.