Technical Analysis of PHB 2024-05-10
Overview:
In analyzing the technical indicators for PHB over the last 5 days, we will delve into the trend, momentum, volatility, and volume indicators to provide a comprehensive outlook on the possible stock price movement in the coming days.
Trend Analysis:
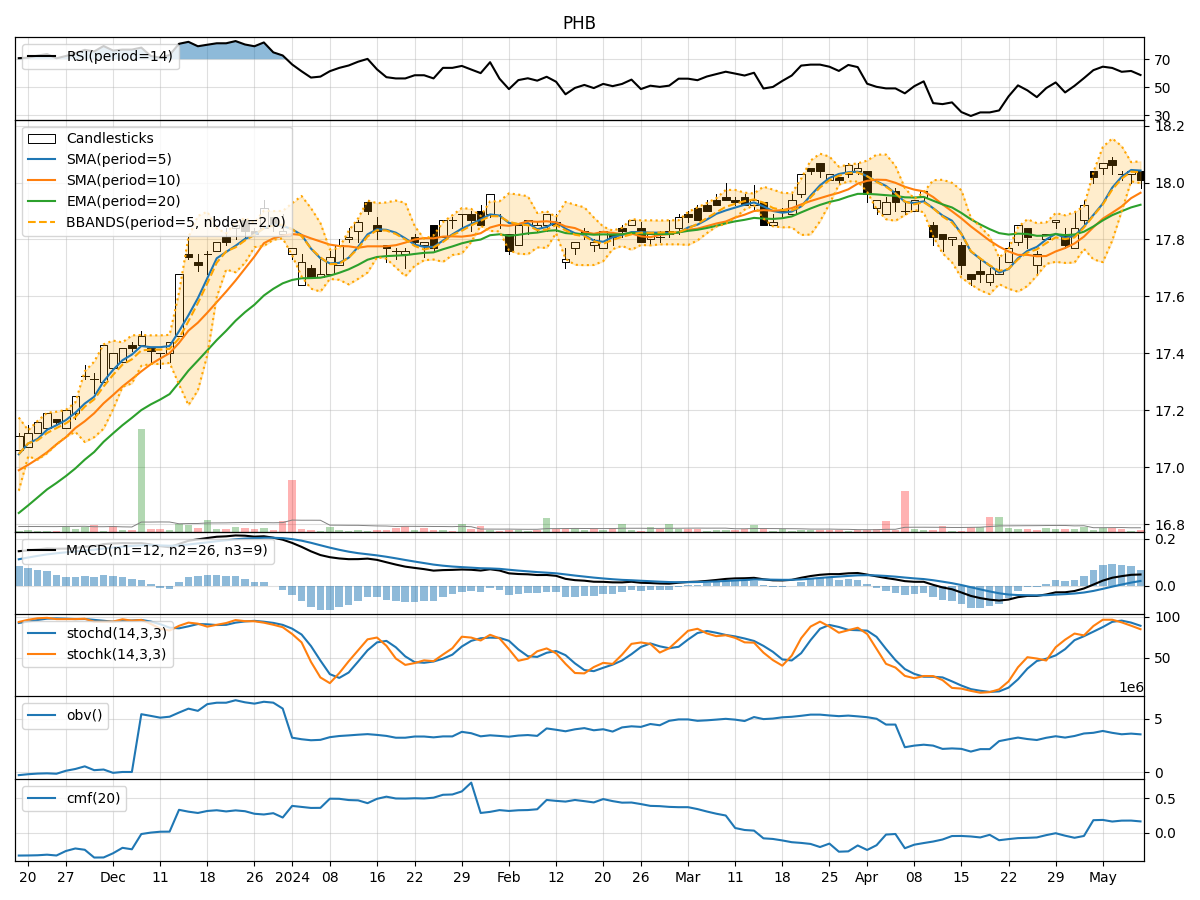
- Moving Averages (MA): The 5-day Moving Average (MA) has been consistently above the Simple Moving Average (SMA) and Exponential Moving Average (EMA), indicating a bullish trend.
- MACD: The MACD line has been above the signal line, with both lines showing an upward trend, suggesting bullish momentum.
Momentum Analysis:
- RSI: The Relative Strength Index (RSI) has been fluctuating around the 60-70 range, indicating moderate momentum.
- Stochastic Oscillator: Both %K and %D have been gradually decreasing, signaling a potential reversal in momentum.
Volatility Analysis:
- Bollinger Bands (BB): The stock price has been trading within the Bollinger Bands, with the bands narrowing, suggesting decreasing volatility.
Volume Analysis:
- On-Balance Volume (OBV): The OBV has been fluctuating, indicating mixed buying and selling pressure.
- Chaikin Money Flow (CMF): The CMF has been relatively stable, showing a neutral stance on money flow.
Key Observations:
- The trend indicators suggest a bullish sentiment, supported by the moving averages and MACD.
- Momentum indicators show a potential weakening of momentum, as indicated by the Stochastic Oscillator.
- Volatility has been decreasing, implying a possible period of consolidation.
- Volume indicators reflect mixed sentiment, with no clear direction in buying or selling pressure.
Conclusion:
Based on the analysis of the technical indicators, the stock price of PHB is likely to experience sideways movement or consolidation in the next few days. While the trend remains bullish, the weakening momentum and decreasing volatility suggest a period of stabilization. Traders may expect the stock price to trade within a narrow range, with limited upside or downside potential. It is advisable to closely monitor key support and resistance levels for potential breakout opportunities.
Recommendation:
- Short-term Traders: Consider range-bound strategies and closely monitor key technical levels for potential entry and exit points.
- Long-term Investors: Maintain a watchful stance and wait for clearer signals before making significant investment decisions.
By combining insights from trend, momentum, volatility, and volume indicators, traders and investors can make informed decisions aligned with the current market dynamics.