Technical Analysis of PHDG 2024-05-10
Overview:
In analyzing the technical indicators for PHDG over the last 5 days, we will delve into the trend, momentum, volatility, and volume indicators to provide a comprehensive outlook on the possible stock price movement in the coming days. By examining these key indicators, we aim to offer valuable insights and predictions for informed decision-making.
Trend Analysis:
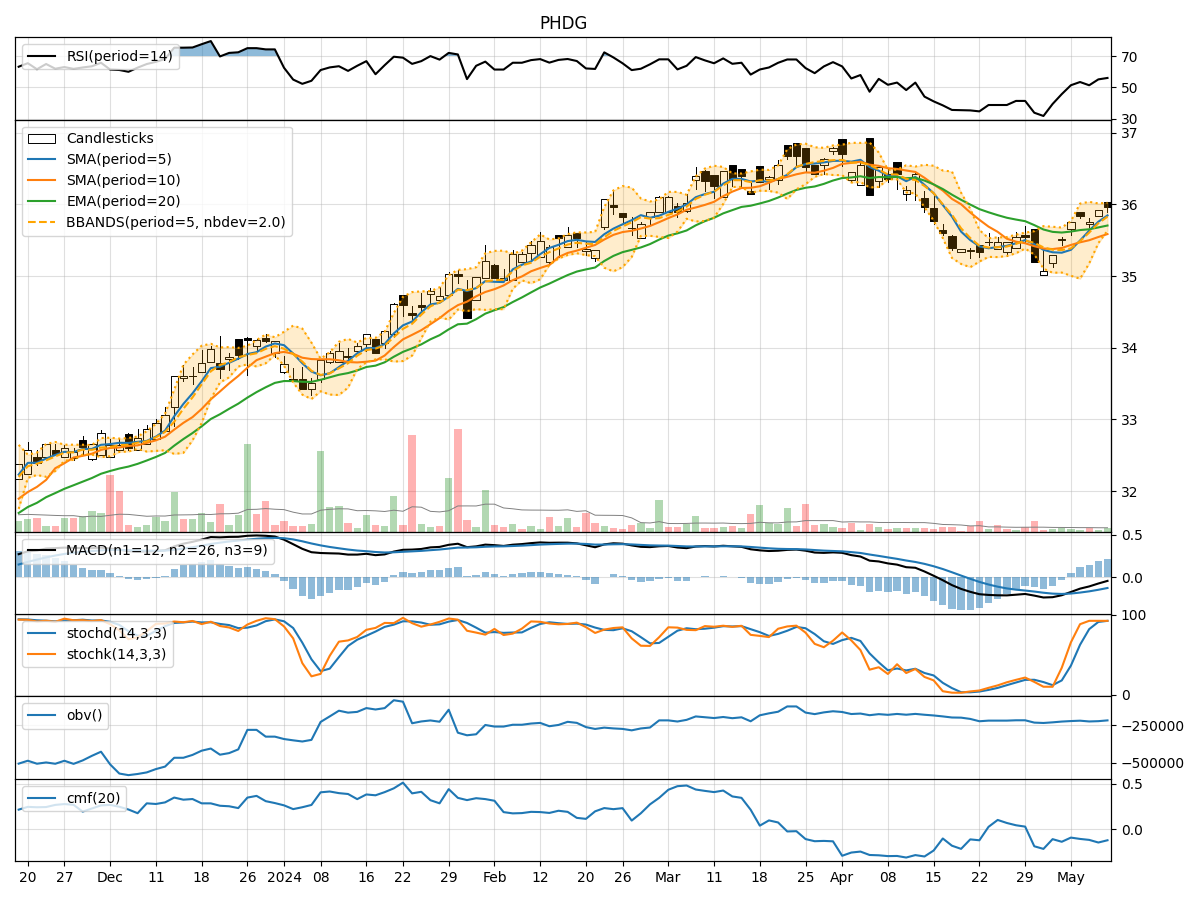
- Moving Averages (MA): The 5-day Moving Average (MA) has been consistently above the Simple Moving Average (SMA) and Exponential Moving Average (EMA), indicating a short-term bullish trend.
- MACD: The MACD line has been negative but showing signs of convergence towards the signal line, suggesting a potential reversal in the bearish momentum.
- MACD Histogram: The MACD Histogram has been gradually decreasing, indicating a weakening bearish momentum.
Momentum Analysis:
- RSI: The Relative Strength Index (RSI) has been fluctuating around the neutral level of 50, indicating a lack of strong momentum in either direction.
- Stochastic Oscillator: Both %K and %D have been in the overbought zone, suggesting a potential reversal or consolidation phase.
- Williams %R: The Williams %R has been hovering around the oversold territory, indicating a possible buying opportunity.
Volatility Analysis:
- Bollinger Bands (BB): The stock price has been trading within the Bollinger Bands, with the bands narrowing, indicating decreasing volatility.
- Bollinger %B: The %B indicator has been fluctuating around 0.8, suggesting a relatively high price compared to the upper band.
Volume Analysis:
- On-Balance Volume (OBV): The OBV has shown mixed signals with fluctuations in volume, indicating indecision among market participants.
- Chaikin Money Flow (CMF): The CMF has been negative, reflecting selling pressure in the stock.
Key Observations:
- The trend indicators suggest a potential reversal in the bearish momentum.
- Momentum indicators show a lack of strong directional bias.
- Volatility has been decreasing, indicating a possible consolidation phase.
- Volume indicators reflect mixed signals with no clear trend in volume accumulation.
Conclusion:
Based on the analysis of the technical indicators, the stock price of PHDG is likely to experience sideways movement in the coming days. The trend indicators point towards a potential reversal in the bearish momentum, while the momentum indicators suggest a lack of strong directional bias. The decreasing volatility and mixed volume signals further support the view of a consolidation phase. Therefore, it is recommended to monitor the stock closely for any signs of a breakout or trend confirmation before making any trading decisions.